By: David Marburger, former OSU Small Grains Extension Specialist
Wheat that was dusted-in or late-planted during the fall 2017 and resulted in spotty stands or no stands at all from a lack of soil moisture was a frustrating and common occurrence for many Oklahoma producers. Unfortunately, the first water some wheat seed imbibed did not occur until after a late-February rainfall. When the remaining seed started germinating and emerging, many were begging the question, “What is a realistic expectation for this late-emerging wheat crop?” In a March 2018 blog article titled, “What can I expect from wheat just now emerging?” I tried addressing several related questions:
- Will these plants produce a head?
- How cold and for how long do the seedlings need to be exposed to cooler temperatures to vernalize?
- Is vernalization completely temperature dependent?
- Do we have information on varietal differences?
- What forage or grain yield potential do I have?
I also mentioned in that article that we were working on gathering more variety-specific information. We had a small, unused space next to the variety demonstration plots at the Stillwater agronomy farm. In that small space we were able to plant more than 30 varieties that were entered in the OSU variety trials last season (Figure 1). These plots were established on March 6 and managed similarly to the “grain-only” demonstration plots located immediately to the north of this area. The “grain-only” demonstration plots were established on October 31, 2017 with a seeding rate of 60 lbs/acre. In-furrow DAP at 50 lbs/acre was also applied. Therefore, the intention was for the planting date to be the only difference.
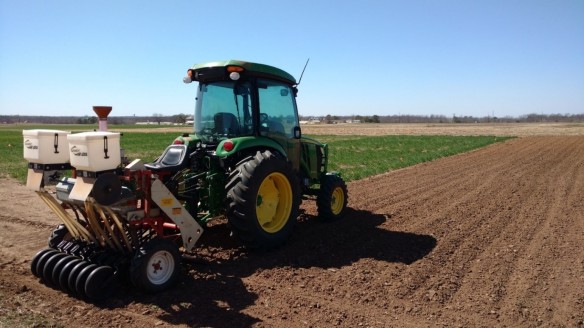
Figure 1. Planting wheat on March 6, 2018 at the Stillwater agronomy farm.

Figure 2. Picture taken on April 26, 2018 of the wheat varieties planted 51 days earlier. The “dual-purpose” and “grain-only” variety demonstration trials are those located to the right of this area. Every wheat variety entered into the variety trials (n = 56) was planted on September 19, 2017 to represent a dual-purpose planting date (background) and on October 31, 2017 to represent a grain-only planting date (foreground).
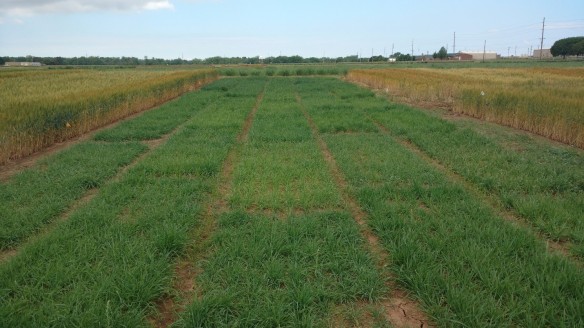

Figure 3. Photos taken on May 16, 2018. The top photo shows the progress of the wheat varieties planted on March 6, 2018. The bottom photo shows the area where the same varieties were planted on October 31, 2017. You can see how some of the varieties in the bottom photo are beginning to “turn.”

Figure 4. Photo taken on June 9, 2018. Some of the varieties planted on March 6, 2018 produced heads while others did not. The right side of the photo shows a few of the varieties from the dual-purpose demonstration trial that were a few days from being harvest-ready.
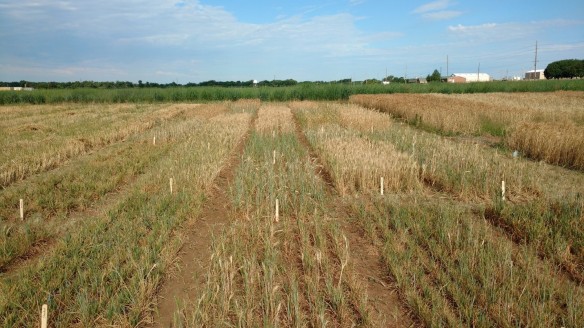
Figure 5. Photo taken on June 21, 2018. This shows the differences in the number of heads produced or lack thereof among varieties planted on March 6, 2018. Varieties within both planting date demonstration trials to the right were harvest-ready for some time by this date.
What did we find?
In the previous blog article, I mentioned that variety-specific vernalization requirements are not fully characterized, but winter wheat varieties adapted to the southern Great Plains may need between 120 to 1080 hours (5 to 43 days) at air temperatures below 45° F to vernalize. Dr. Brett Carver feels three weeks (504 hours) of exposure to constant temperatures below 45° F should be sufficient for most varieties in Oklahoma, but reducing that to two weeks (336 hours) may cause vernalization issues for some varieties.
After this demo was established, we experienced a cool March and April overall. In fact, April 2018 ended up being the second coldest on record. Hourly weather data provided by Wes Lee from the Stillwater Mesonet station showed that we accumulated 368 hours after March 6 where the average air temperature was less than 45° F. The last calendar day which had at least one hour with an average temperature below 45° F was April 28.
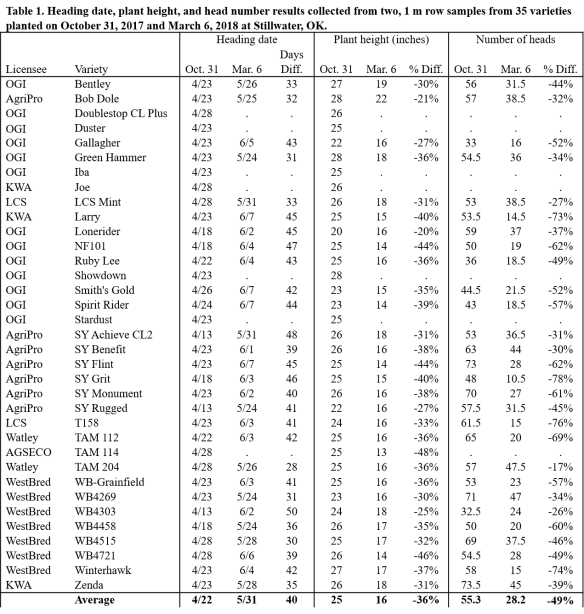
As a result of these conditions, we found 28 of 35 varieties (80%) produced heads. The heading dates for those varieties are provided in Table 1. For the 28 varieties which produced heads, we collected samples from the plots planted on March 6, 2018 and October 31, 2017 in order to make comparisons for a few plant characteristics. Two subsamples were collected from each plot within both planting dates. Each subsample consisted of 1 m of row. Plant height, head number, total biomass, total grain weight, harvest index, and seed weight were measured from each subsample. The data for each plant characteristic was averaged from the two subsamples within each planting date, and the results are presented in Tables 1 and 2.
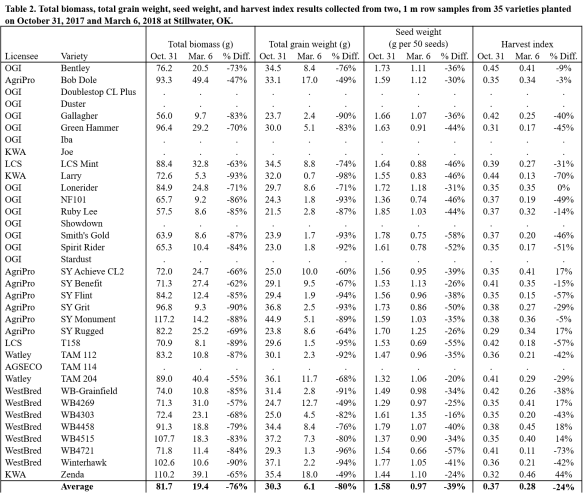
Results Summary
- 28 of 35 varieties (80%) produced heads to some level. The varieties which did not produce heads were Doublestop CL Plus, Duster, Iba, Joe, Showdown, Stardust, and TAM 114.
- Compared to the same varieties planted on October 31, 2017, the 28 varieties which produced heads and were planted on March 6, 2018 on average:
- headed 40 days later (range of 28 to 50 days later);
- were 36% shorter in plant height (range of -20% to -48%);
- produced 49% less number of heads (range of -17% to -78%);
- produced 76% less total biomass (range of -47% to -93%);
- produced 80% less total grain weight (range of -49% to -98%);
- had reduced seed weight per 50 seeds by 39% (range of -16% to -58%);
- had reduced harvest index by 24% (range of +44% to -70%)
Other Observations
A couple producers also shared some of their findings from late-emerging fields. Fred Schmedt near Altus, OK mentioned that some of their Bentley and Smith’s Gold which was planted into cotton stubble and emerged in the first week of March did produce grain. The yields they had were pretty similar to those for the same varieties in our demonstration. Jimmy Kinder near Walters, OK also had some Bentley which produced grain, and his yield was slightly better than yield for Bentley in our demonstration.
As a comparison to Stillwater, Wes Lee also provided me the hourly weather data from the Altus and Walters Mesonet stations. The number of accumulated hours beginning after March 6 where the average air temperature for the hour was below 45° F was 277 for Altus and 245 for Walters. The true number of accumulated hours though depended on the time when the seed of these varieties in these fields imbibed water and sprouted.
Final Thoughts
Hopefully Oklahoma winter wheat producers will never run into this problem again, and we can just put these data on the shelf to collect dust. If it does happen again though, these observations can at least give us a starting point to help aid in making more confident and timely decisions on how to move forward. However, it does not look good for forage or grain yield potential any way you slice it (as likely expected), and contacting your agent if you have crop insurance to discuss your options is highly advised. Also keep in mind that these results are from one location in one year under the cultural practices used. Seeding rate is an example of how cultural practices may influence the results. Using a higher seeding rate in attempt to compensate for less tiller production in a late-planted wheat scenario may not reduce total biomass and grain yield as dramatically compared to the observations in our demonstration.
