Meriem Aoun, Small Grains Pathologist
As wheat harvest progresses across Oklahoma, reports have emerged of smut-contaminated grain being received at elevators in central Oklahoma. It has not been confirmed whether the issue is caused by loose smut or stinking smut (common bunt). Additionally, observations of “dark heads” have been reported in some wheat fields in certain varieties. These reports have prompted this update to highlight potential grain issues that may be encountered, as well as to outline considerations for affected grain.
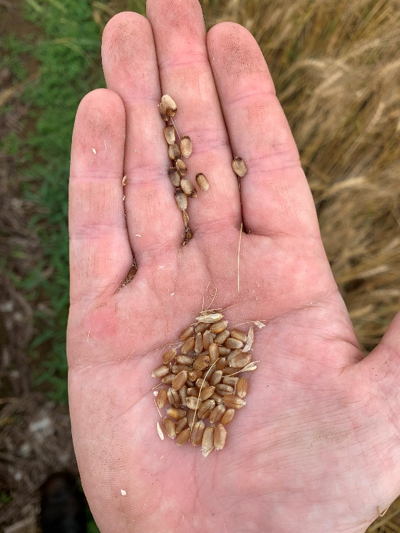
Black point
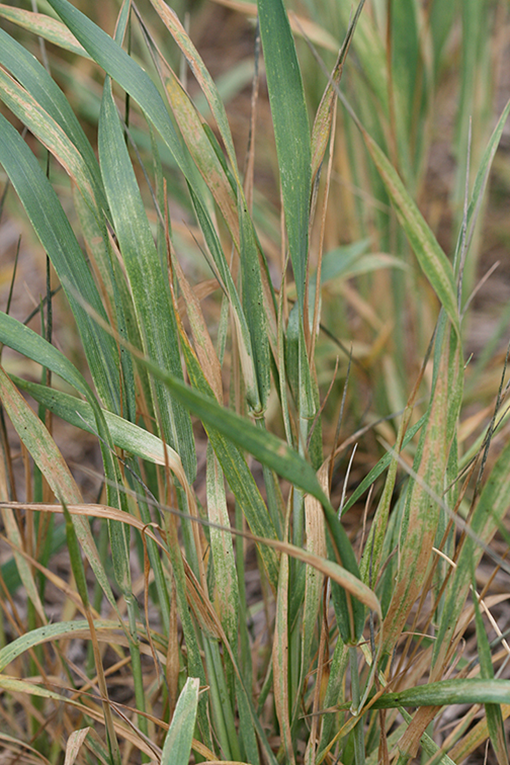
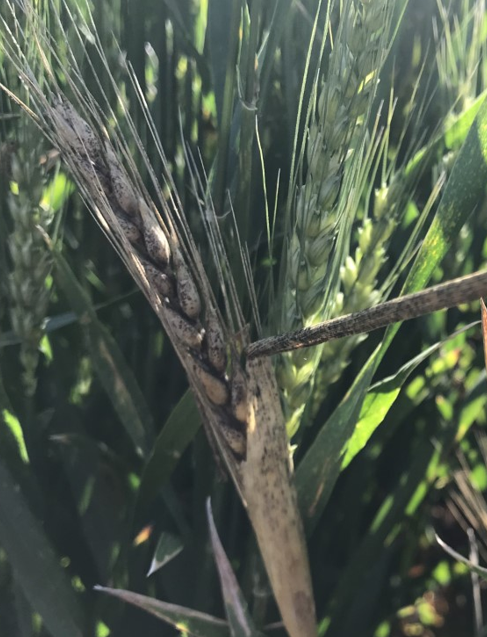
Wheat kernels may show a dark discoloration at the germ end that extends toward the center of the seed and into the crease. This symptom is characteristic of black point (Figure 1). Black point is a discoloration typically affecting the germ end and may result from infection by various fungi, often saprophytes that colonize dead tissue but can occasionally infect living tissue, or from environmental conditions that promote discoloration in the absence of a pathogen. This issue is commonly associated with freeze injury or delayed harvest, where dead tissue in the heads becomes heavily colonized by fungi that cause sooty mold (Figure 2).
Kernels with black point can have reduced germination if used for seed, leading to poor stand establishment. Therefore, if wheat with black point had to be used for planting, it is important to test seed germination and use an appropriate seed treatment to manage seed and seedling rots. In addition, I received questions about potential health risks for consumers of whole wheat flour produced from grain affected by black point. Black point in wheat grain can result in dark flecks in milled flour, reducing flour quality. However, black point is not associated with known human/animal health issues.
Loose smut and common bunt
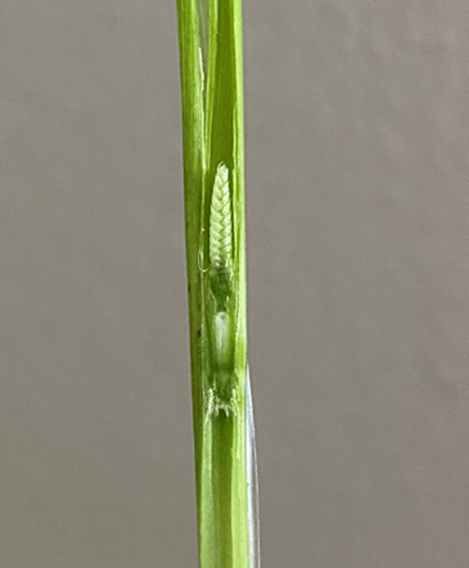
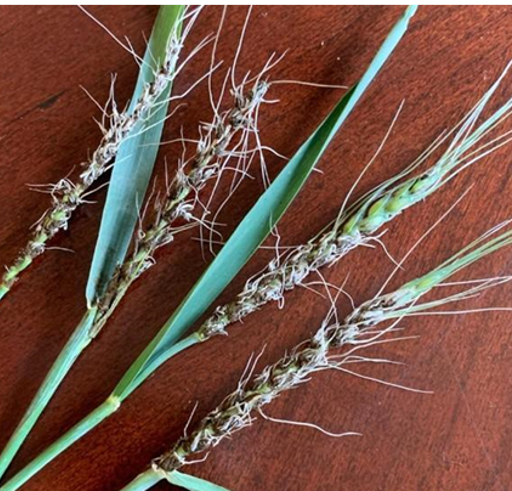
Common bunt (also known as stinking smut) is often mistaken for loose smut, but the two diseases differ significantly. Loose smut is easy to identify in the field during heading because infected plants produce heads filled with loose, black spores (Figure 3). The infection processes also differ. Spores of the loose smut fungus are carried by wind to healthy wheat heads, where they infect developing kernels around the time of flowering. As a result, the fungus becomes established inside the seed itself. Grain from infected plants poses no issue if used for milling. However, problems arise when that infected grain is planted as seed the following season. In such cases, the fungus grows within the developing seedling. When the plant reaches heading, it produces a smutted head full of black, powdery spores instead of a normal grain head.
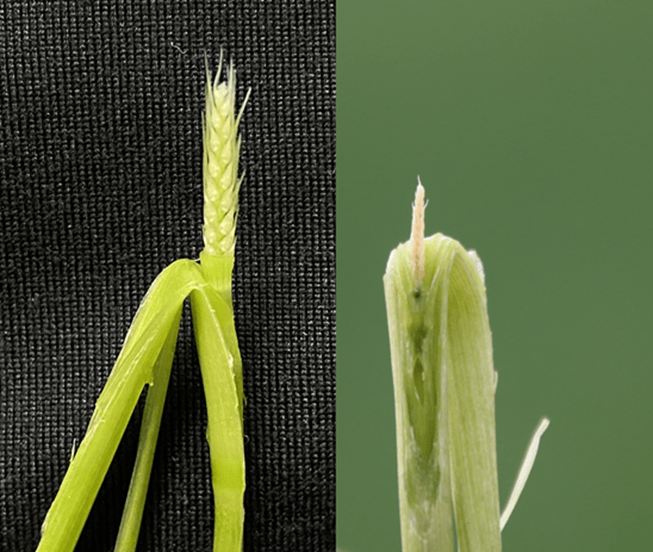
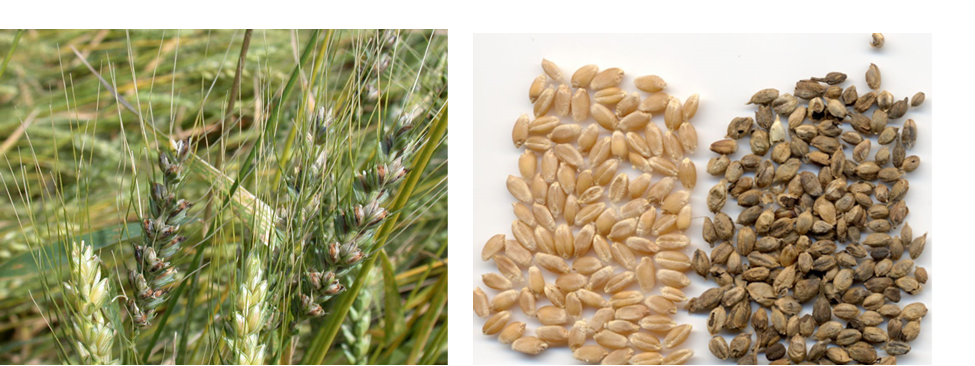
In contrast to loose smut, common bunt results in the formation of “bunt balls” in wheat heads (Figure 4), which break and spread spores that contaminate healthy kernels as well as the soil. Unlike loose smut, where the fungus resides inside the seed, common bunt fungus spores survive on the surface of wheat kernels or in the soil. In the fall, as wheat germinates, common bunt fungus spores also germinate and infect young seedlings. The fungus then grows within the plant and as the crop reaches heading and begins to mature, the pathogen replaces developing kernels with bunt balls rather than normal grain. A key distinguishing feature between these two diseases is odor. Loose smut produces no noticeable smell, whereas common bunt is associated with a strong musty or fishy odor, particularly under severe infestations. This odor can result in grain being downgraded or even rejected at grain elevators. Consequently, common bunt poses risks both for grain marketed for flour and for use as seed.
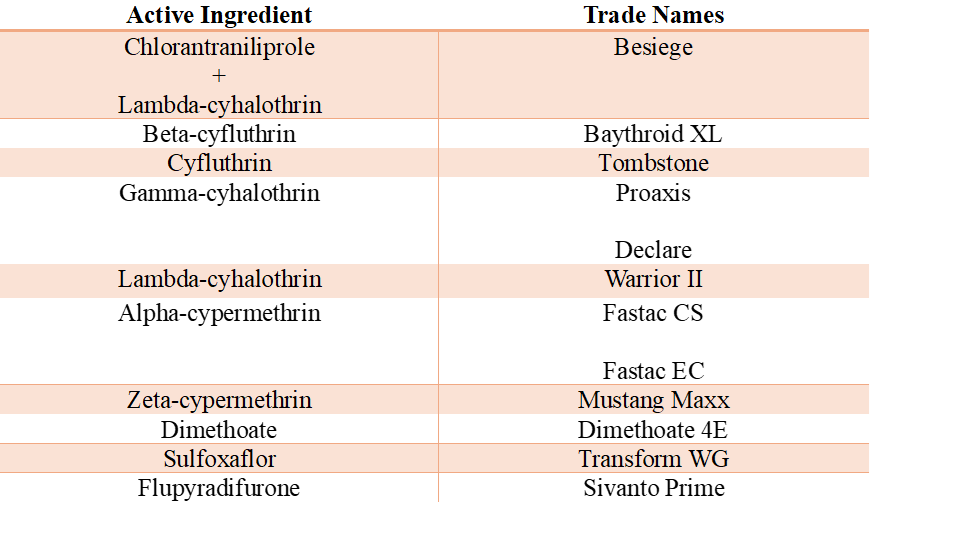
Grain harvested from fields infested with either loose smut or common bunt is not recommended for use as seed in the following seasons. However, if contaminated grain must be used as seed, a high-rate fungicide seed treatment should be applied. A useful starting reference for selecting an appropriate seed treatment is the table provided on pages 336–338 of the 2025 OSU Extension Agents’ Handbook of Insect, Plant Disease, and Weed Control (OCES publication E-832). This resource includes many of the commonly used seed treatment options.
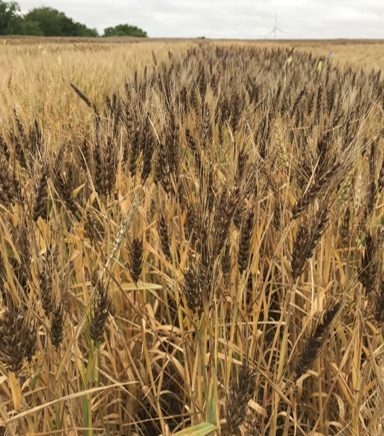
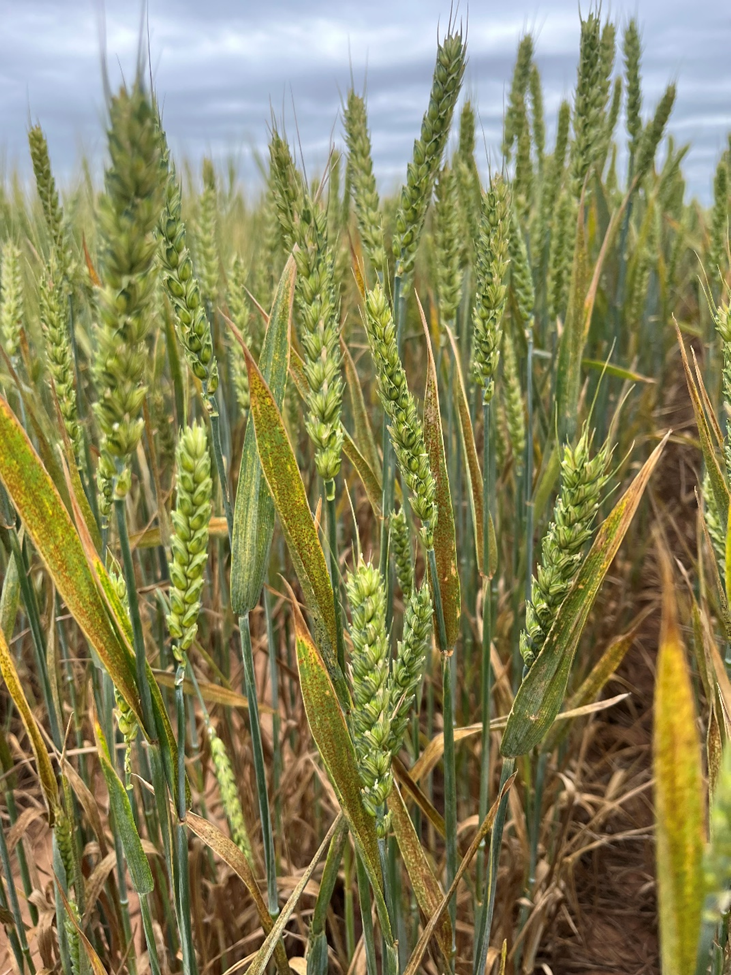
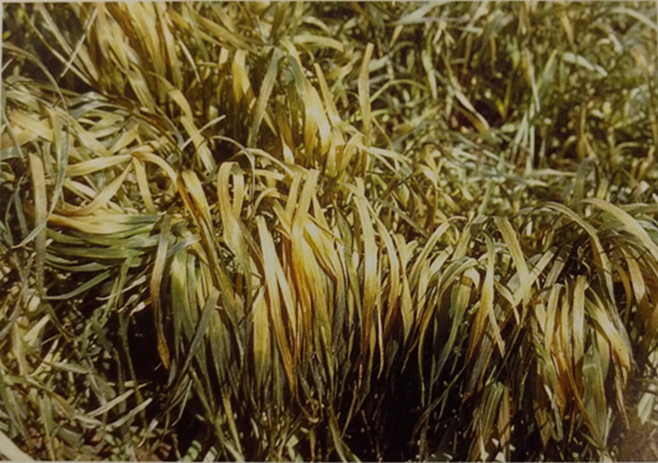
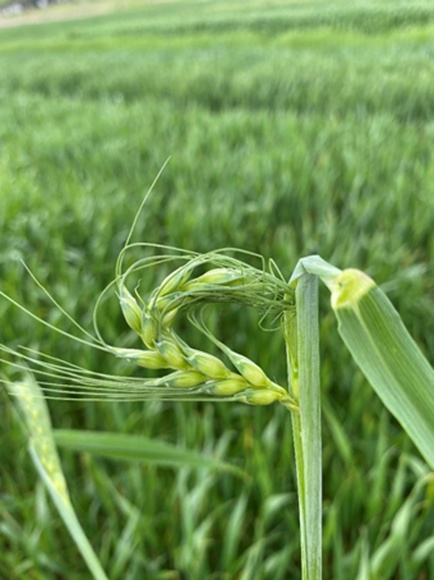
Dark wheat heads
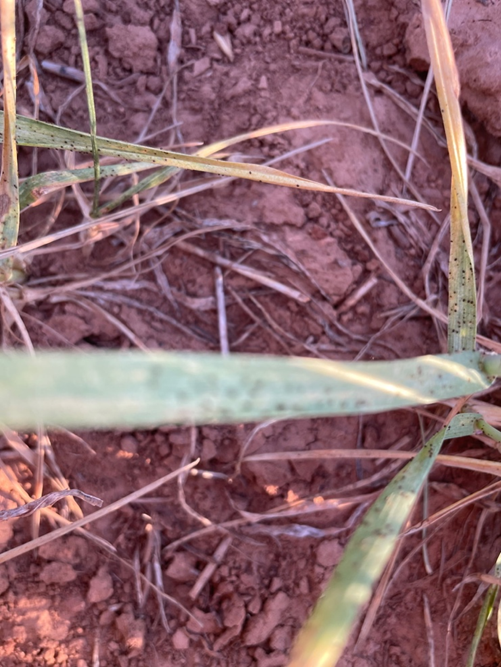
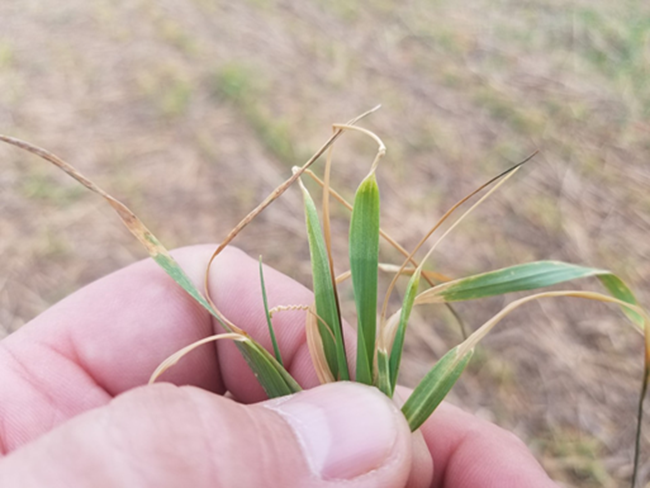
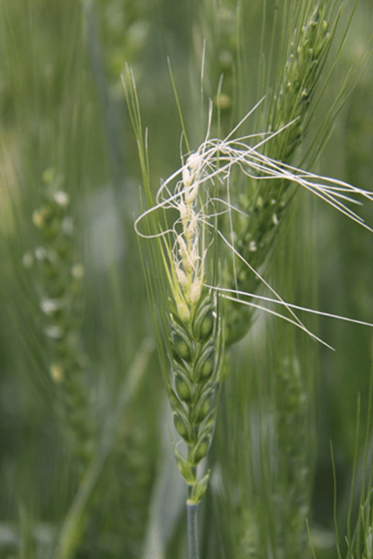
I have also observed and received reports of dark bronze discoloration of chaff in some winter wheat varieties (Figure 5). These symptoms are most likely associated with environmental stress, particularly drought conditions. The discoloration has been noted in varieties such as ‘Green Hammer,’ ‘Bentley,’ ‘Baker’s Ann,’ and ‘Joe.’ In some cases, the darker head appearance may be more pronounced in varieties with wild wheat relatives in their pedigree. Grain produced from these darkened heads remains unaffected.