Barley yellow dwarf and wheat streak mosaic are widespread and severe in multiple Oklahoma wheat production regions
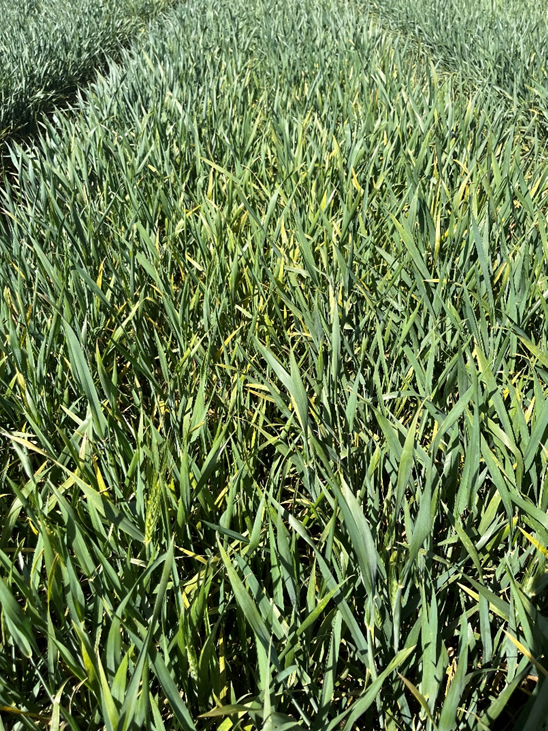
Barley yellow dwarf (BYD) remains severe in multiple locations in Oklahoma. Symptoms of BYD include stunting and yellow or purple discoloration on leaf tips (Figure 1). The discoloration increases over time, progressing from the leaf tip toward the base until much or all of the leaf is discolored. Barley yellow dwarf virus is transmitted by cereal aphids. When infection occurs in the fall, the virus has more time to disrupt plant growth, and yield losses are usually higher than when infection occurs in the spring. This season, BYD has been observed in Payne, Noble, Grant, Woods, Texas, Garfield, and Grady counties. The high incidence of BYD in 2026 could be attributed to warmer winter conditions, which favored aphid survival and virus transmission. In addition, freeze stress earlier in the spring may have contributed to more pronounced BYD symptom expression.
Figure 1. Barley yellow dwarf symptoms in Stillwater, OK (April 7, 2026).
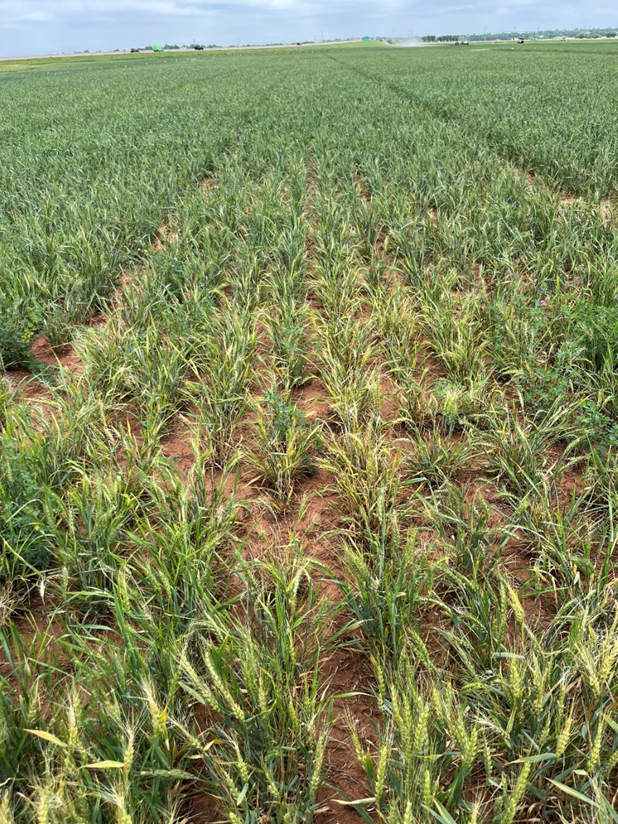
Since early March, wheat streak mosaic (Figure 2) has been observed in Blaine, Garvin, Noble, Kay, Texas, Payne, Beaver, Kingfisher, Garfield, and Grady counties. The WSM virus complex, includes wheat streak mosaic virus (WSMV), Triticum mosaic virus (TriMV), and the High Plains wheat mosaic virus (HPWMV), all of which are transmitted by the wheat curl mite. Samples submitted to the OSU Plant Disease and Insect Diagnostic Lab, indicated that WSMV was the most commonly detected virus. Compared with previous years, the frequency of TriMV has increased. Triticum mosaic virus was confirmed in samples from Garvin, Texas, Grant, Beaver, and Kingfisher counties. In most cases, TriMV was detected alongside WSMV, although some samples were infected with TriMV alone. High Plains wheat mosaic virus was also detected, but at lower frequency and confirmed in samples from Kingfisher, Kay, Garvin, and Blaine counties.
Figure 2. Wheat infected with wheat streak mosaic at Chickasha, OK (April 24, 2026).
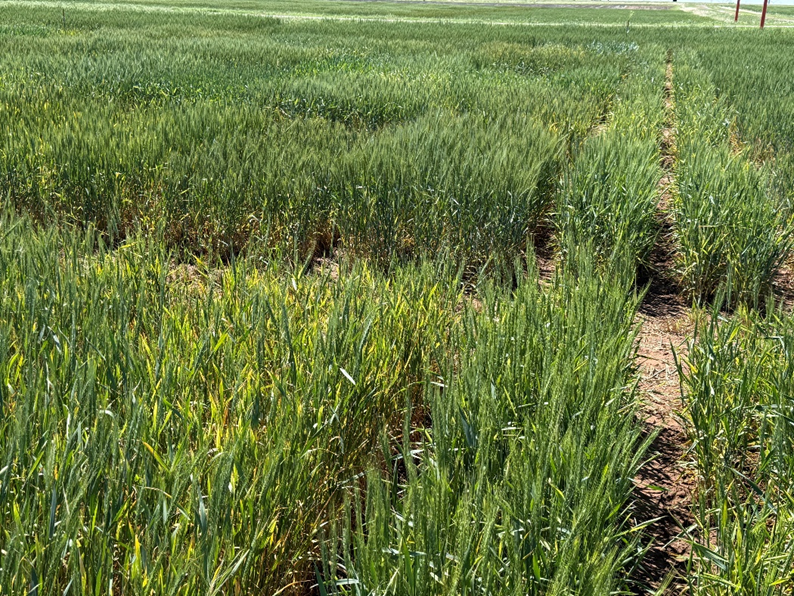
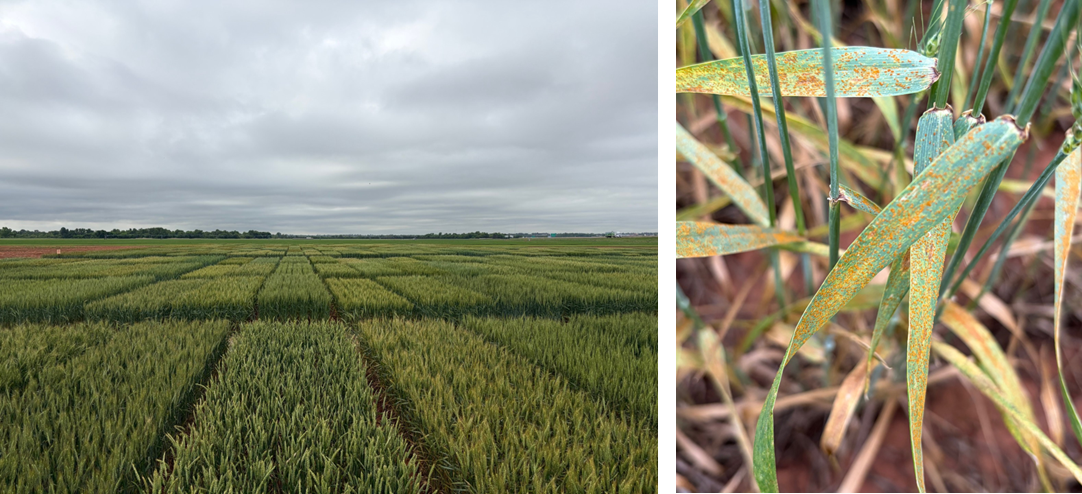
Wheat plants exhibiting symptoms of both BYD and WSM (Figure 3) were observed in Garfield, Grady, Payne, Noble, Grant, and Texas counties. Co‑infection with multiple viruses can increase symptom severity and yield losses.
Figure 3. Wheat research plots showing symptoms of barley yellow dwarf and wheat streak mosaic at Lahoma, OK (April 18, 2026; Photo by Dr. Brett Carver).
High leaf rust incidence and severity
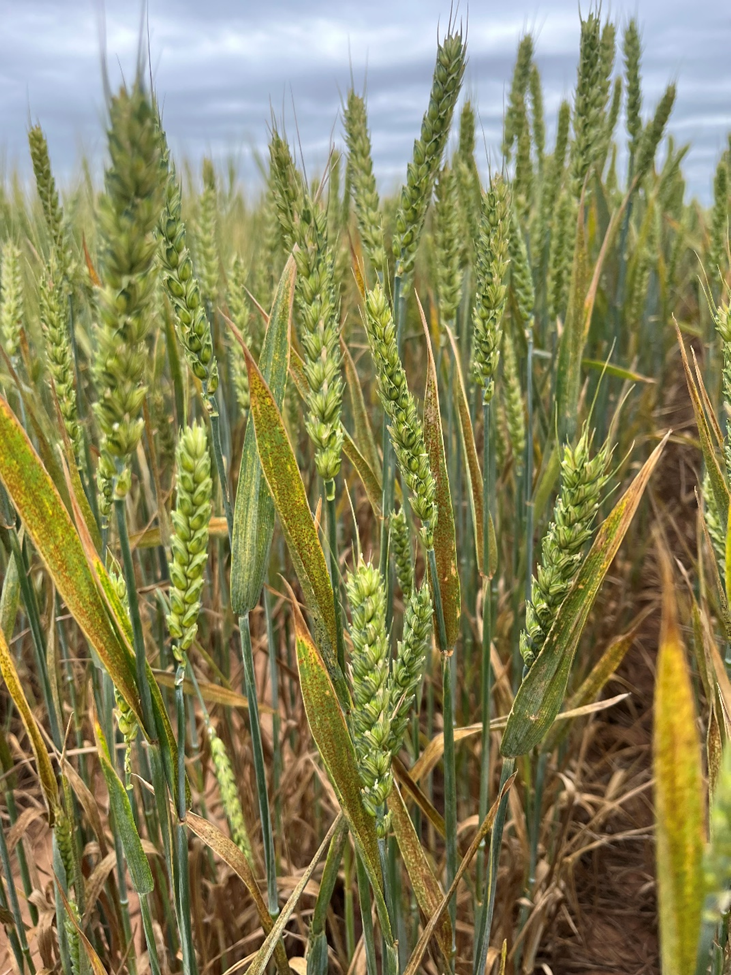
Leaf rust incidence and severity increased rapidly during the last two weeks of April and into early May. Leaf rust has been observed in nearly every field visited across Oklahoma, including drought‑stressed fields in southwest Oklahoma. On April 20, low levels of leaf rust were detected in the variety trial at Walters (Cotton County in southwest OK). Higher incidence and severity have been observed in other locations in Central and North Central Oklahoma. On April 24, moderate levels of leaf rust were observed at Chickasha (Grady County). Higher incidence and severity developed during late April and early May at Stillwater (Payne County) and Lahoma (Garfield County), where severity reached up to 100% on susceptible varieties. As leaf rust increased, much of the wheat crop had already passed the flowering stage, limiting opportunities for fungicide application. At this stage, the primary line of defense is the use of resistant varieties. Because infection occurred relatively late in crop development, yield losses associated with leaf rust will be lower than those that could have occurred if infection had occurred earlier.
Figure 4. Leaf rust on a susceptible variety at Lahoma, Oklahoma (April 26, 2026).
Amanda de Oliveira Silva, Small Grains Extension Specialist
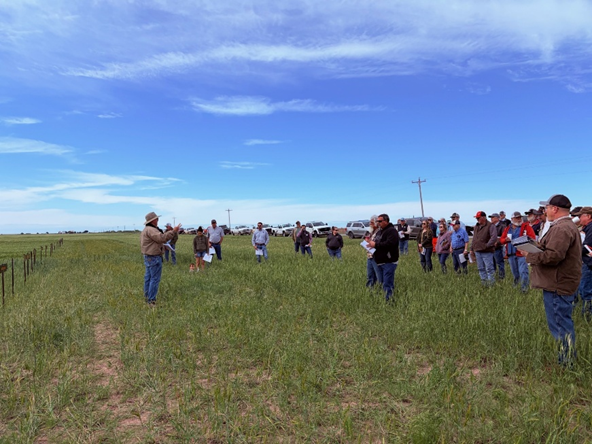
Last week, we kicked off our wheat plot tour season in Oklahoma, with our first stops in southwestern Oklahoma—Altus and Walters—and south-central Oklahoma in Chickasha. Plot tours are always a valuable opportunity to evaluate variety performance and visit with producers, and these first stops gave us an early look at the challenging conditions many wheat fields are facing across the state this season.
Figure 1. Wheat plot tour at the Dual-Purpose Wheat Variety Trial in Walters, where producers and OSU specialists evaluated variety performance and discussed the impacts of drought stress and early leaf rust development on the crop. Kinder Farms, April 20, 2026.
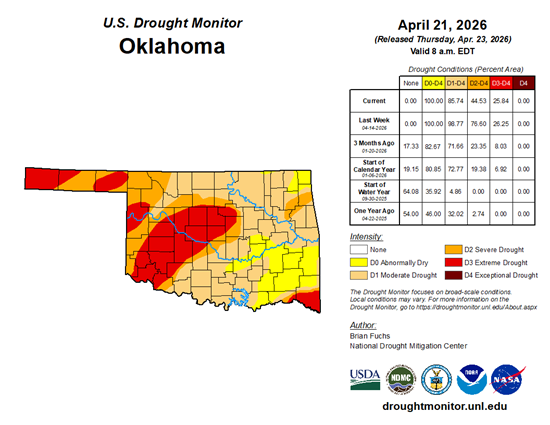
For anyone following the weather, the story is not surprising. Prolonged drought since last fall, combined with above-normal temperatures through winter and early spring, has taken a significant toll on the crop (Figure 2).
Across much of southwest Oklahoma, moisture has been extremely limited for months. Some fields never established properly, and in the driest areas, stands remain poor, thin, and uneven. In several cases, producers have already made the difficult decision to abandon fields or graze them out, as yield potential no longer justifies the cost of taking the crop to harvest, or in some cases, there simply is not enough crop there to harvest.
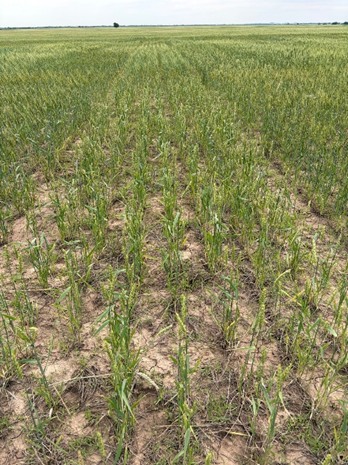
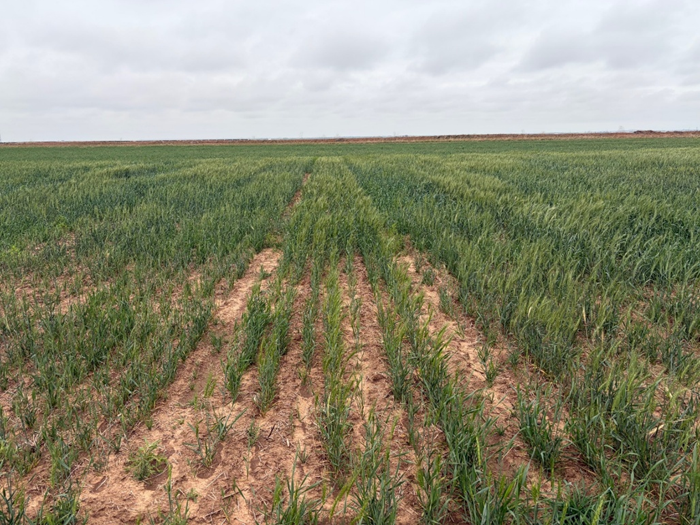
At our Walters dual-purpose and Altus stops, drought stress was impossible to miss (Figures 3 and 4). Short plants, reduced tillering, and accelerated development were common across fields. When wheat undergoes stem elongation and grain set under moisture stress and heat, the crop has less time and fewer resources to build and fill grain, directly reducing yield potential.
Figure 3. Dual-purpose wheat variety trial in Walters. This trial was planted on September 25, 2025, and grazed at a stocking rate of 154 lbs/ac. The crop has faced multiple challenges throughout the season, including armyworm and grasshopper infestations in the fall, brown wheat mite pressure in early spring, and persistent drought since planting. The first significant rainfall occurred during the first week of April (2.8 inches). Kinder Farms, April 20, 2026.
Figure 4. Wheat variety trial in Altus, planted on November 25, 2025. This trial received very limited rainfall after planting, resulting in poor stand establishment, as shown in the photo. Stand variability is high, plants are extremely short, and tillering is reduced due to prolonged drought stress. The center plot shown is representative of many fields in the region, where yield potential has been severely reduced, and some fields have already been abandoned for grain harvest. Altus, April 21, 2026.
Conditions in Chickasha were somewhat better compared to the southwest, but variability remains high. Planting date, soil type, and how much rainfall individual fields have received are making a big difference in how the crop is holding on.
The recent rains were certainly welcome and should provide some benefit to fields that are still in fair to moderate condition, especially those now entering grain fill. However, for many fields we are approaching a point of diminishing returns. Rain at this stage can help preserve yield potential, but it cannot fully restore what was lost from poor establishment and prolonged stress earlier in the season.
On top of drought stress, we are also seeing some disease pressure. Viral diseases such as Wheat streak mosaic and Barley yellow dwarf remain present in some areas, and leaf rust has begun to develop where conditions have turned favorable. While disease pressure is not the main driver of yield loss right now, it can add another layer of stress to an already compromised crop (Figure 5).
Figure 5. Wheat variety trials in Chickasha showing severe leaf rust infestation in susceptible varieties. Recent rainfall and favorable temperatures have improved crop conditions but also accelerated fungal disease development, increasing pressure on varieties lacking resistance. Chickasha, April 24, 2026.
At this point, yield prospects will depend heavily on how long the crop can maintain green leaf area and continue grain fill over the next few weeks. But overall, statewide yield expectations are trending below average.
Even with the challenges this season, our plot tours remain a valuable opportunity to see how varieties are performing under real field conditions, review the latest research from our programs, and talk through the conditions you’re seeing in your area.
We encourage you to join us at one of our upcoming stops (see schedule here). Every season teaches us something, and this year is another strong reminder of how dependent Oklahoma wheat production is on timely rainfall.
Reports from southwest Oklahoma indicate Bird Cherry Oat Aphid (BCOA) infestations in winter wheat. While these aphids are often present in Oklahoma wheat every year, heavy infestations—especially during the grain-fill stages or in fields intended for grazing—can lead to economic loss through direct feeding and the transmission of viral diseases.
Identification and Differentiation from Other Small Grain Aphids
The Bird Cherry Oat Aphid is relatively easy to identify if you know what to look for, but it can be confused with the Rice Root Aphid (RRA).
Bird Cherry Oat Aphid (BCOA), Rhopalosiphum padi:
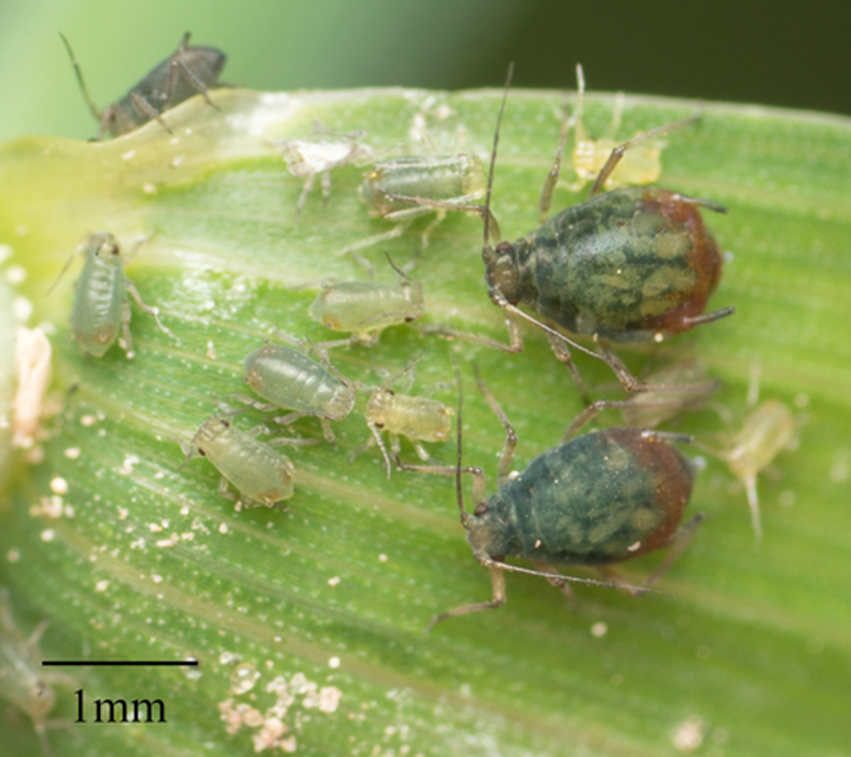
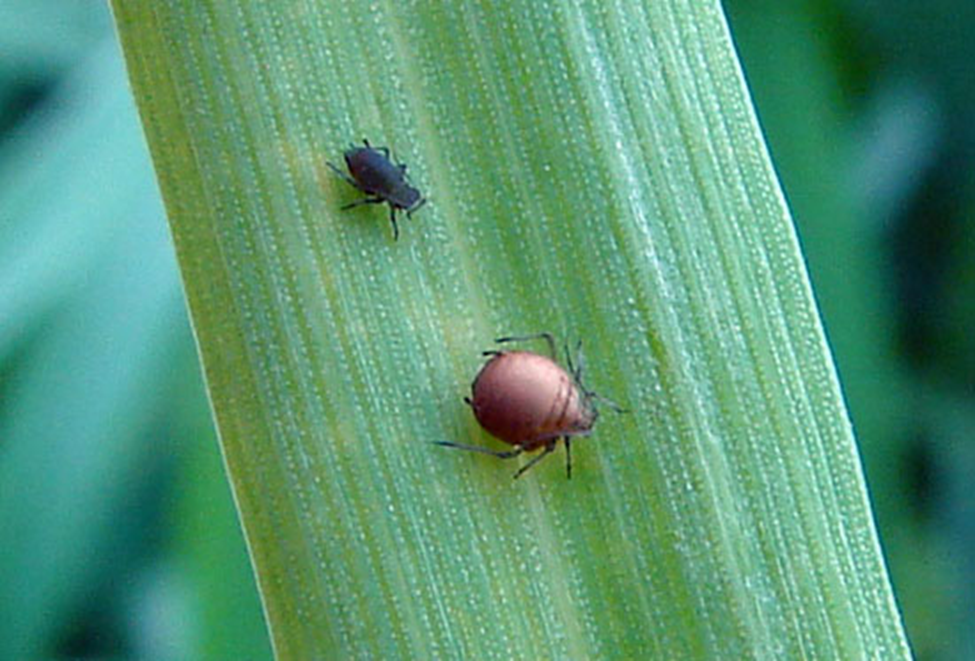
Appearance: Small, pear-shaped, olive-green to greenish-black bodies. Tips of legs are black. “Old” aphids found in winter and early spring often are black but will give birth to more typically colored aphids in the spring.
Key Feature: A distinctive reddish-orange or “rusty” patch at the rear of the abdomen, specifically surrounding the base of the cornicles (tailpipes) (Figure 1).
Location: Primarily found on the leaves and stems in the lower to middle canopy and can be found throughout the wheat growing season. When in high numbers, feeding can result in honeydew.
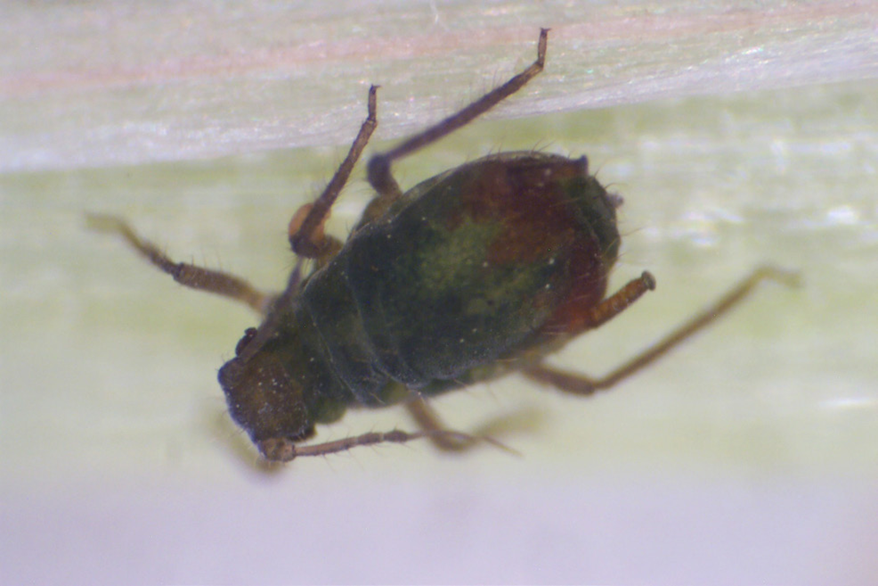
Appearance: Very similar in color and possesses a reddish-orange patch.
Key Differences: The RRA has a hairy appearance with long & prominent hairs on its antennae and body (Figure 2)
Location: As the name suggests, RRA is typically found at or below the soil line on the roots or the very base of the crown. BCOA will stay on the green tissue above ground. RRA typically appear in the fall, soon after wheat emerges.
Figure 1. Bird cherry oat aphid (BCOA) adults and nymphs. Image courtesy of iNaturalist.Figure 2. Rice root aphid (RRA) adults can appear similar to BCOA. RRA are rarely economically damaging. Image courtesy Rick Grantham, OSU.
BCOA Biology
In Oklahoma and the southern Great Plains, BCOA populations consist entirely of females that give birth to live young (parthenogenesis). This allows for extremely rapid population growth when temperatures are mild. They can survive the winter as active nymphs and adults in the wheat canopy, though their development slows during extreme cold. As the wheat matures or populations become crowded, winged alates are produced to migrate to other fields.
BCOA Damage: Feeding and Disease
The impact of BCOA is twofold:
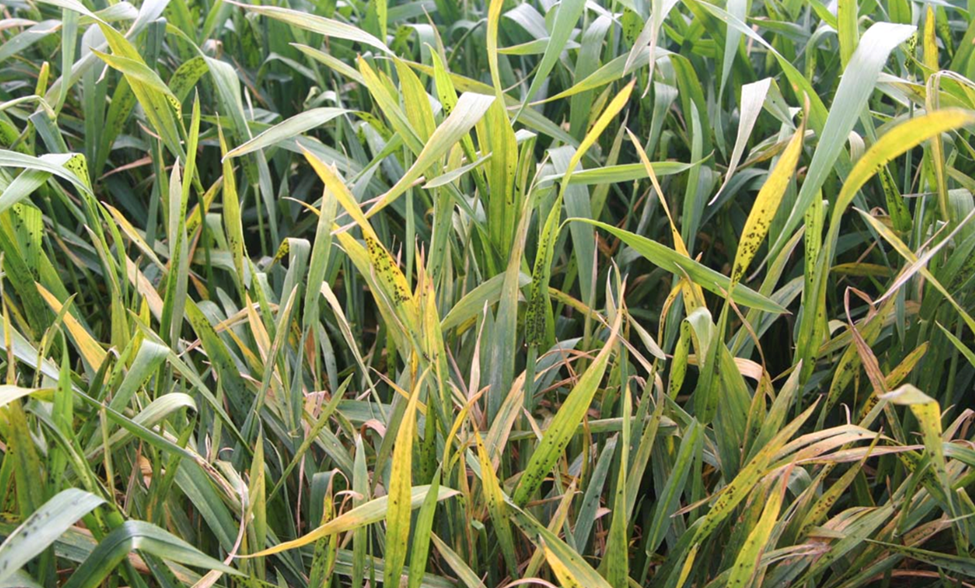
Direct Feeding Damage: BCOA are sapsuckers. Large numbers can cause leaf yellowing and stunting (Figure 3). In grazing systems, BCOA feeding can interfere with protein assimilation in the plant, potentially reducing the nutritional quality of the forage for cattle.
Viral Transmission: BCOA is a primary vector for Barley Yellow Dwarf Virus (BYDV).
Symptoms: Infected wheat displays brilliant yellow or reddish-purple leaf tips. Plants infected in the fall are often severely stunted and have significantly reduced root systems, leading to high yield loss (Figure 3). Spring infections are usually less severe but still impact test weights.
Figure 3. Heavy bird cherry oat aphid (BCOA) with honeydew accumulation and chlorosis/stunting. Image courtesy Angus Catchot, Mississippi State Extension.
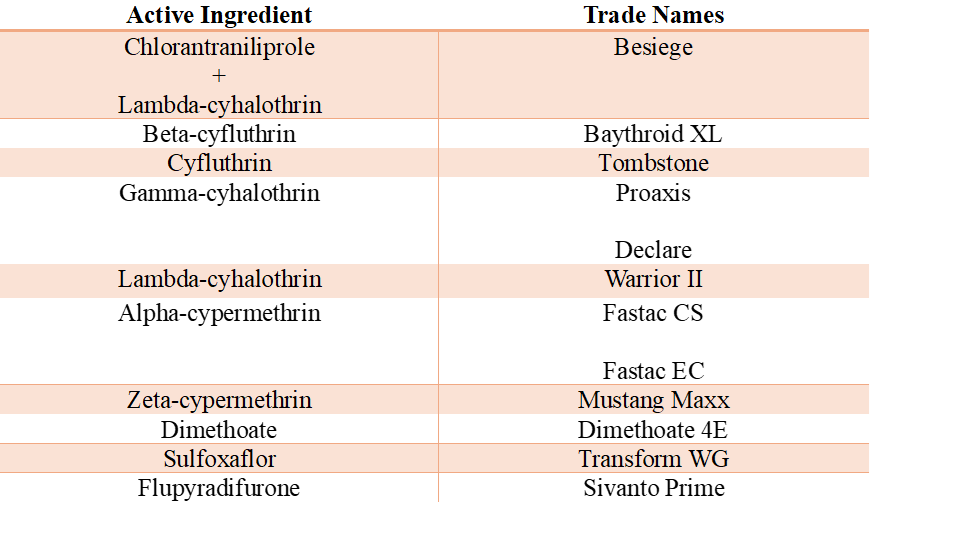
Scouting Techniques Because BCOA often hides in the lower canopy or in the “whorl” of the plant, thorough scouting is essential. Method: Examine 25 randomly selected tillers across a zigzag transect of the field. Focus: Look closely at the underside of leaves and inside the leaf sheaths. Threshold: While wheat can tolerate a surprising number of BCOA, treatment is generally recommended if populations reach 20 to 50 aphids per tiller during the seedling to boot stages. If the wheat is under moisture stress or if the goal is to prevent BYDV spread in early spring, use the lower end of the threshold. Management Recommendations Natural Enemies: Before spraying, check for the “Three L’s”: Lady beetles, Lacewings, and Lysiphlebus (parasitic wasps). If you see aphid mummies, bloated, tan/bronze-colored aphid husks (Figure 4), the wasps are actively working. If natural enemy populations are high, they can often crash an aphid population without the need for chemicals. Based on recent observations, natural enemy numbers appear be on the low end this year. Chemical Control: Several insecticides are labeled for BCOA in wheat (Table 1). Organophosphates or pyrethroids are generally effective but be mindful of the flare risk: sometimes spraying for aphids can kill natural enemies and lead to a secondary surge of other pests like mites. We are having widespread reports of brown wheat mites across Oklahoma. BCOA can be spot sprayed with a ground-sprayer. Before spraying any insecticides consider the return on investment: Estimate yield loss: Calculate the average number of aphids per tiller from your scouting ( = # aphids/# tillers). Estimate crop value: Crop Value = Yield Potential X Price per Bushel Estimate control costs: Control Cost = Insecticide Cost + Application Cost Estimate preventable loss: Crop Value X Yield Loss from Aphid (0.07) Approximately 5-9% yield loss occurs when there are 20-40 BCOA per tiller, making average yield loss from BCOA to be 7% or 0.07. If preventable loss is greater than control costs, then treat! Cultural Control: For future seasons, delaying planting can reduce the window for fall BCOA migration and subsequent BYDV infection.
Figure 4. Bird cherry oat aphid (BCOA) and brown mummy. These mummies are a result of an aphid being parasitized by Lysiphlebus testceipes wasps.
Table 1. Some foliar insecticides for bird cherry-oat aphid (BCOA) in wheat. The mention, listing, or use of specific insecticides is not an endorsement of that product, nor is it a criticism of similar products not mentioned.
Always follow pesticide label directions, application sites, and rates. Be sure to read and follow the label for preharvest intervals (PHI) and restricted-entry intervals (REI). Use a minimum of 10 GPA by ground and 3 GPA by air (if labelled for aerial application) to ensure adequate coverage.
For assistance with aphid identification or treatment decisions, see OSU Fact Sheet EPP-7099 Small Grain Aphids in Oklahoma and Their Management, or contact your local OSU Extension office.
Ashleigh Faris, Cropping Systems Entomologist, IPM Coordinator
Following a period of dry weather, wheat growers in central Oklahoma are reporting activity of the Brown Wheat Mite (BWM). Unlike many other wheat pests, BWM thrives in drought conditions, and its damage can often be mistaken for moisture stress or nutrient deficiency.
Identification
The Brown Wheat Mite is small—about the size of a needle point—but is generally easier to spot than the Wheat Curl Mite because it is active on the leaf surface.
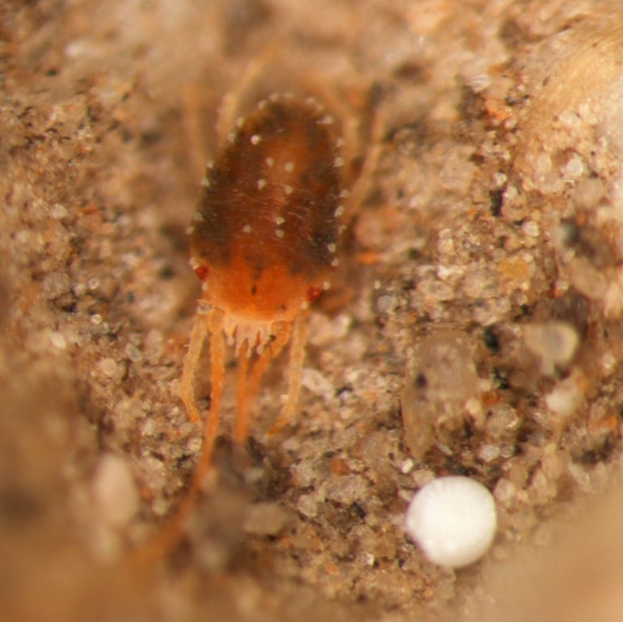
Appearance: BWM has a dark red to brownish-black, oval-shaped body (Figure 1).
Distinguishing Feature: Its front legs are significantly longer than its other three pairs of legs.
Behavior: They are most active during the day, particularly in the afternoon, and will quickly drop to the ground if the plant is disturbed (Figure 2).
Figure 1. Brown wheat mite (BWM).
Figure 2. Brown wheat mites (BWM) on wheat. Image courtesy L. Galvin, OSU Extension.
Biology and Life Cycle
BWM populations consist entirely of females that produce offspring without mating (parthenogenesis), allowing for extremely rapid population growth under dry conditions. The BWM has a unique life cycle in that it can lay two types of eggs. Environmental conditions dictate when these two types of eggs are laid:
Red Eggs: Laid during the growing season and hatch in about a week when conditions are favorable.
White (Diapause) Eggs: Laid as temperatures rise and the crop matures. They are highly resistant and allow the population to survive the summer heat, hatching only when cooler, wetter weather arrives in the fall.
Damage
BWM damage is caused by the mites piercing plant cells and sucking out the plant nutrients.
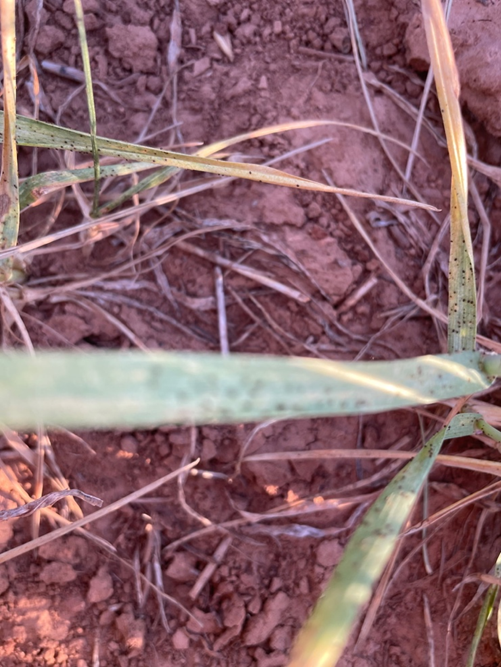
Symptoms: Initial damage appears as “stippling” (fine white or yellow spots) on the leaves. As feeding continues, leaves take on a silvery or bronzed appearance (Figure 3).
Tipping: Heavy infestations cause the tips of the leaves to turn brown and die.
Weather Interaction: Damage is most severe when plants are already under drought stress. Because both BWM damage and drought cause yellowing/browning, it is essential to confirm the presence of mites before treating.
Figure 3. Brown wheat mite (BWM) damage
Scouting
Because BWM is highly mobile and drops when disturbed, careful scouting is required:
Timing: Scout during the warmest part of the day when mites are most active on the upper leaves.
The Paper Test: Gently but quickly shake or tap wheat plants over a white piece of paper or a white clipboard. Look for tiny dark specks moving across the surface.
Economic Threshold: While thresholds vary based on crop value and moisture stress, research suggests a treatment threshold of 25 to 50 brown wheat mites per leaf in wheat that is 6 inches to 9 inches tall is economically warranted. An alternative estimation is “several hundred” per foot of row. If the wheat is severely stressed, the lower end of that threshold should be used.
Management Recommendations
The “Rain” Factor: A significant, driving rain is often the most effective control for BWM. Rain can physically knock mites from the plant and promote fungal pathogens that naturally reduce the population.
Chemical Control: If populations exceed the threshold and no rain is in the forecast, chemical intervention may be necessary. Know the cost of the treatment and value of your wheat so you can determine if an application is a worth return on investment.
Effective Ingredients: Organophosphates (such as Dimethoate) have historically provided better control than many pyrethroids, as the latter can sometimes result in mite “flaring” or simply fail to provide adequate residual control.
Coverage: High water volume is critical to ensure the insecticide reaches the mites, especially if they have moved toward the base of the plant.
Cultural Practices: Since BWM thrives in dry, dusty conditions, maintaining good soil moisture and vigorous plant growth can help the crop tolerate feeding. Here’s to hoping for some rain soon in the forecast; we could really use it for lots of reasons in Oklahoma.
Amanda de Oliveira Silva, Small Grains Extension Specialist
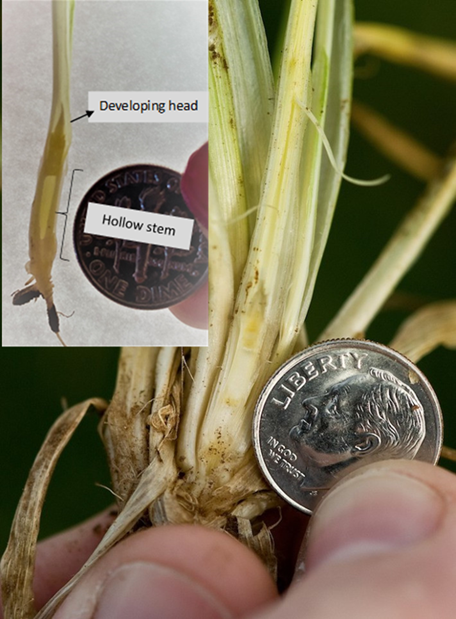
The first hollow stem stage indicates the beginning of stem elongation or just before the jointing stage. It is a good indicator of when producers should remove cattle from wheat pasture. This occurs when there is 1.5 cm (5/8”, or the diameter of a dime) of hollow stem below the developing grain head (see full explanation).
The latest FHS results from OSU forage trials in Stillwater (Table 1) and Chickasha (Table 2) are listed below. For an additional resource and wheat update on FHS, see the Mesonet First Hollow Stem Advisor.
OSU Small Grains Program monitors FHS occurrence on a twice-per-week basis
As in previous years, we will continue monitoring FHS occurrence in our wheat plots at Stillwater and Chickasha and share updates on this blog. In past years, our forage trials—where FHS samples are collected—were seeded early to simulate a grazed system, though forage was not removed. This method created an accelerated growth environment, allowing us to identify the earliest onset of FHS. Varieties that reach FHS earliest in these trials should be closely monitored in commercial fields.
This year, we are continuing with a new approach by simulating grazing with a mower in the forage trial in Stillwater. This will allow us to compare whether varieties reach FHS at different times when grazed versus non-grazed. We hypothesize that the simulated grazing treatment will likely delay FHS relative to the non-grazed treatment, with FHS differences among varieties becoming less pronounced. We also hypothesize that the amount of delay will vary among varieties, such that an early-FHS variety in the non-grazed environment may appear more intermediate in its FHS arrival with canopy removal. This comparison will provide insight into how canopy removal from grazing impacts the timing of reproductive development.
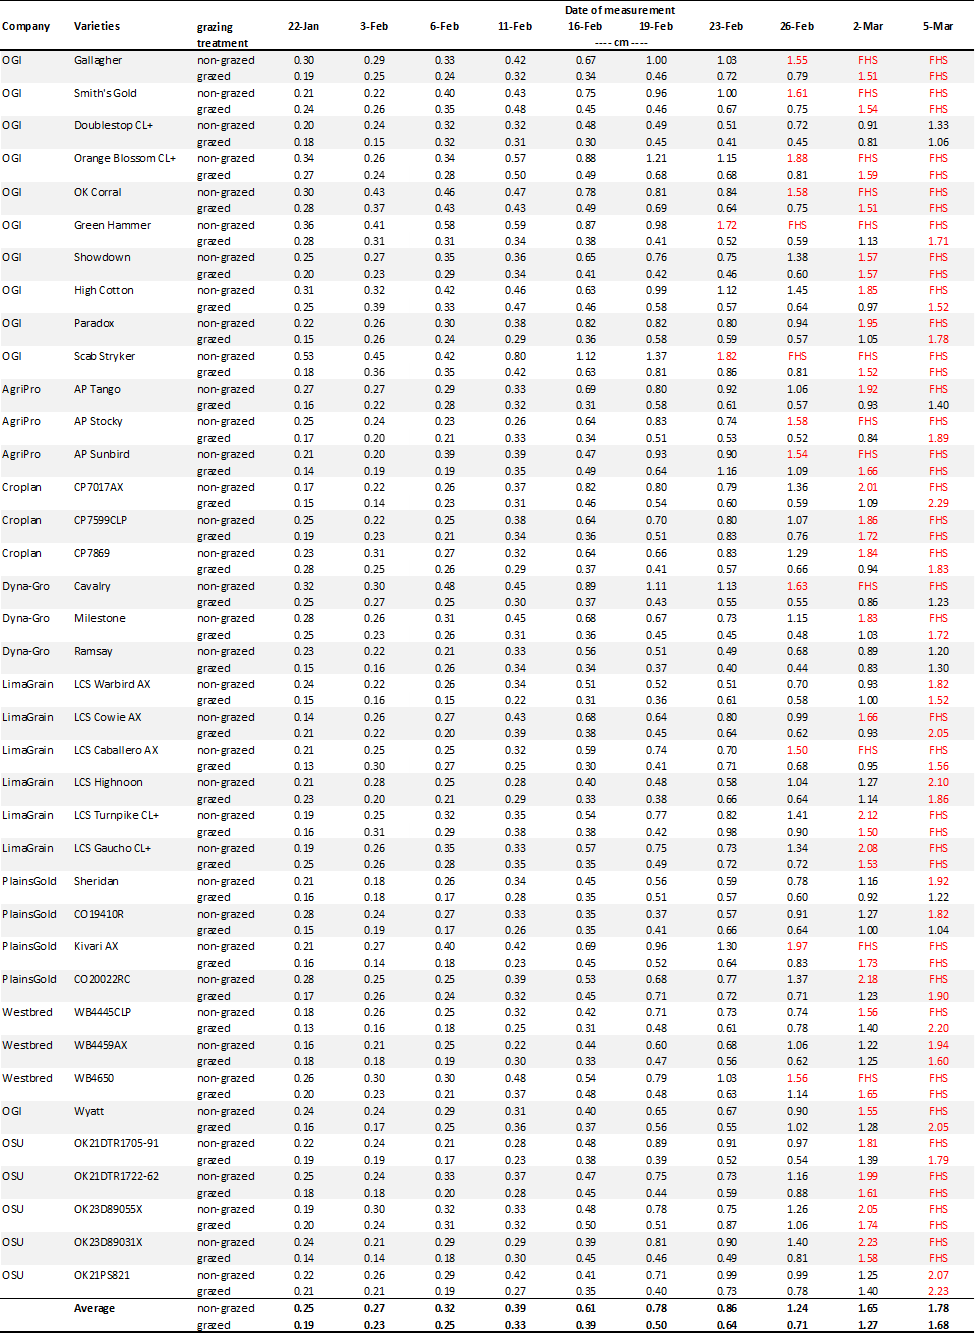
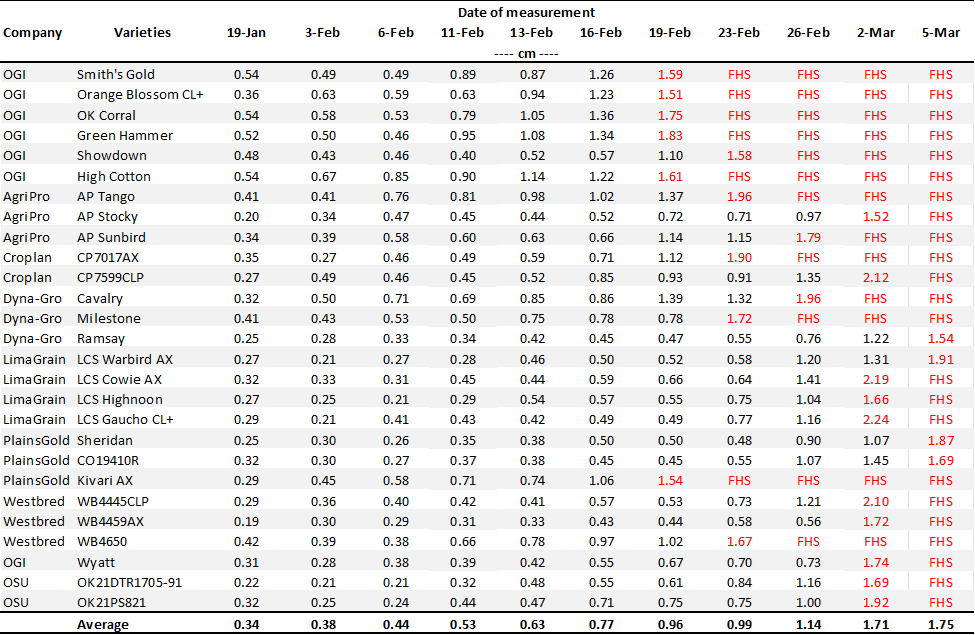
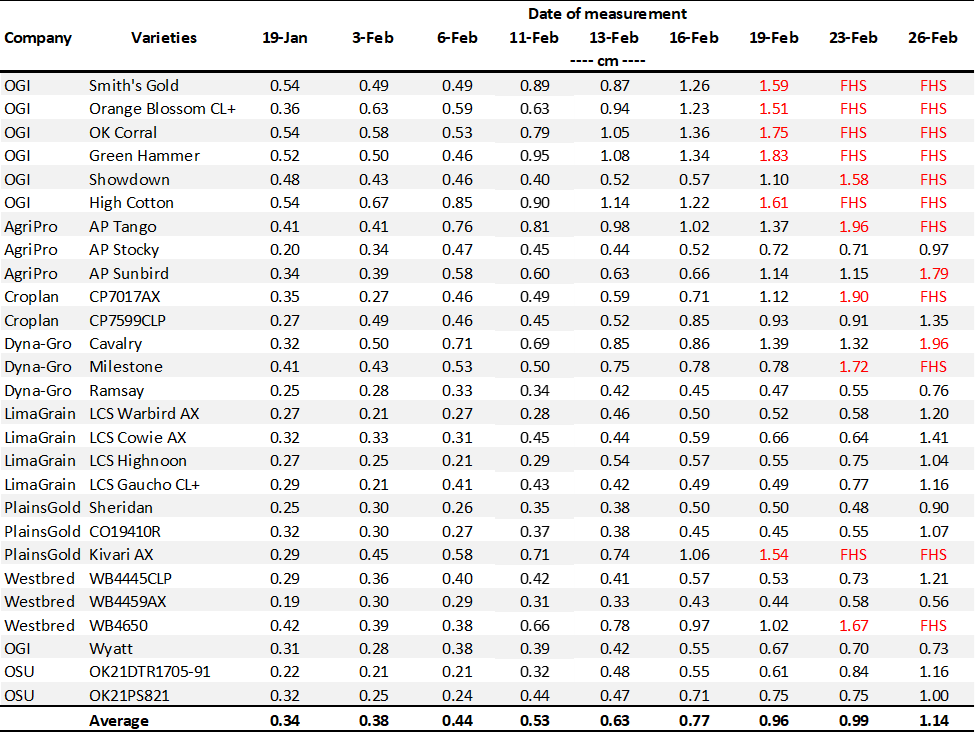
The latest FHS results for each variety planted in our forage trials at Stillwater and Chickasha are summarized below (Tables 1 and 2). Most varieties have reached the 1.5 cm FHS threshold.
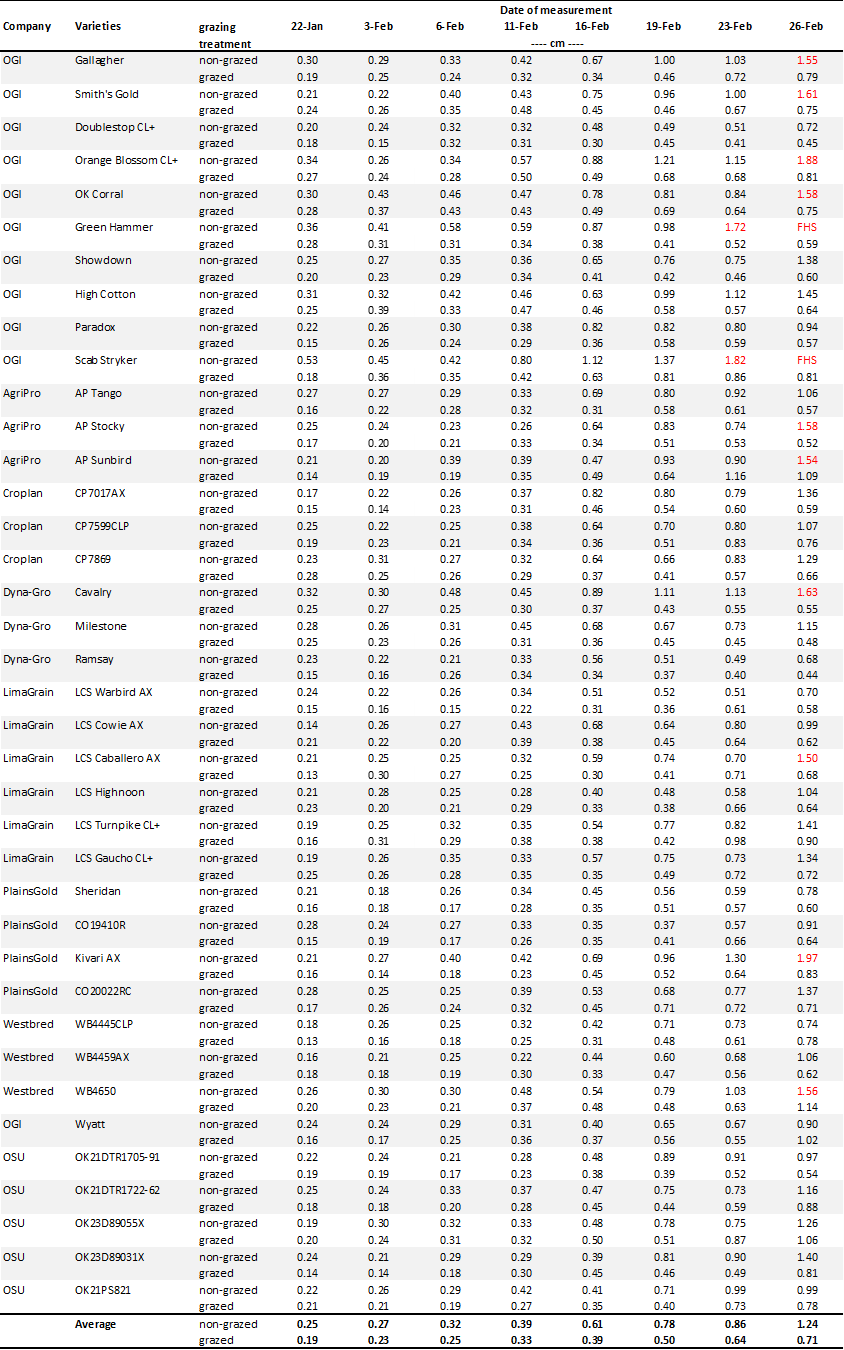
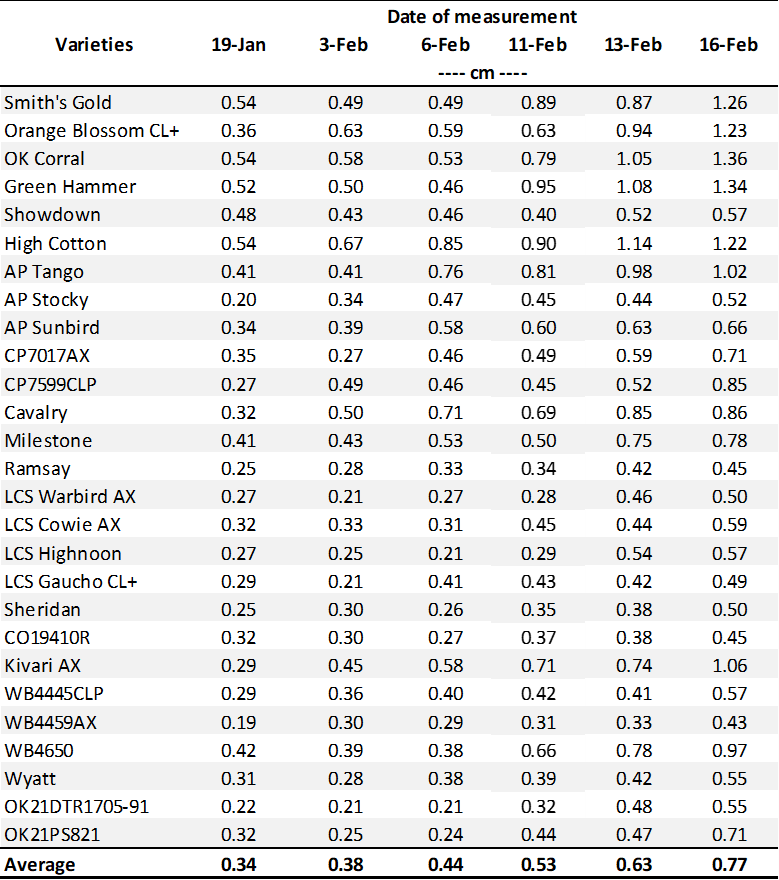
Table 1. First Hollow Stem (FHS) results for each wheat variety collected at Stillwater. Plots were planted on 10/10/2025, with one section left unclipped and the other clipped to simulate grazing. The FHS threshold is 1.5 cm (5/8″ or approximately the diameter of a dime). Reported values represent the average of ten measurements per variety. Varieties that exceed the threshold are highlighted in red. For the simulated grazing, plots were mowed on January 2nd and 13th, and on February 9th and 16th at a 3” cutting height, with the frequency representing a light grazing treatment.
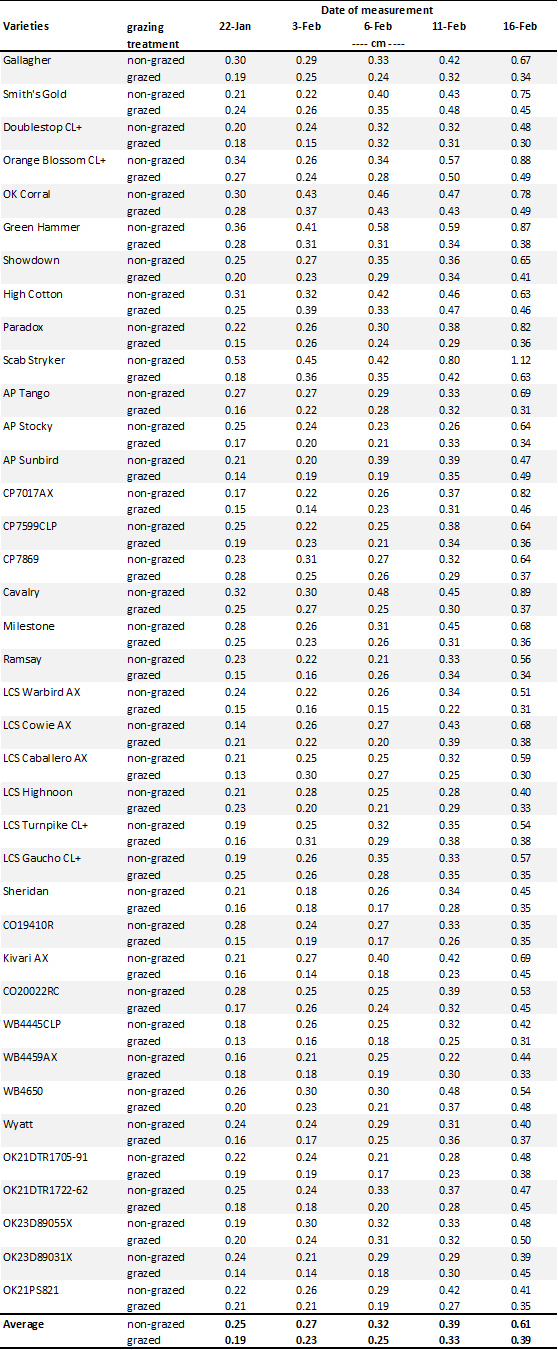
Table 2. First Hollow Stem (FHS) results for each wheat variety collected at Chickasha. Plots were planted on 9/25/2025, with all sections left unclipped (i.e., not grazed). The FHS threshold is 1.5 cm (5/8″ or approximately the diameter of a dime). Reported values represent the average of ten measurements per variety. Varieties that exceed the threshold are highlighted in red.
Contact your local Extension office and us if you have questions.
Amanda de Oliveira Silva, Small Grains Extension Specialist
The first hollow stem stage indicates the beginning of stem elongation or just before the jointing stage. It is a good indicator of when producers should remove cattle from wheat pasture. This occurs when there is 1.5 cm (5/8”, or the diameter of a dime) of hollow stem below the developing grain head (see full explanation).
The latest FHS results from OSU forage trials in Stillwater (Table 1) and Chickasha (Table 2) are listed below. For an additional resource and wheat update on FHS, see the Mesonet First Hollow Stem Advisor.
OSU Small Grains Program monitors FHS occurrence on a twice-per-week basis
As in previous years, we will continue monitoring FHS occurrence in our wheat plots at Stillwater and Chickasha and share updates on this blog. In past years, our forage trials—where FHS samples are collected—were seeded early to simulate a grazed system, though forage was not removed. This method created an accelerated growth environment, allowing us to identify the earliest onset of FHS. Varieties that reach FHS earliest in these trials should be closely monitored in commercial fields.
This year, we are continuing with a new approach by simulating grazing with a mower in the forage trial in Stillwater. This will allow us to compare whether varieties reach FHS at different times when grazed versus non-grazed. We hypothesize that the simulated grazing treatment will likely delay FHS relative to the non-grazed treatment, with FHS differences among varieties becoming less pronounced. We also hypothesize that the amount of delay will vary among varieties, such that an early-FHS variety in the non-grazed environment may appear more intermediate in its FHS arrival with canopy removal. This comparison will provide insight into how canopy removal from grazing impacts the timing of reproductive development.
The latest FHS results for each variety planted in our forage trials at Stillwater and Chickasha are summarized below (Tables 1 and 2). Some varieties have reached the 1.5 cm FHS threshold.
Table 1. First Hollow Stem (FHS) results for each wheat variety collected at Stillwater. Plots were planted on 10/10/2025, with one section left unclipped and the other clipped to simulate grazing. The FHS threshold is 1.5 cm (5/8″ or approximately the diameter of a dime). Reported values represent the average of ten measurements per variety. Varieties that exceed the threshold are highlighted in red. For the simulated grazing, plots were mowed on January 2nd and 13th, and on February 9th and 16th at a 3” cutting height, with the frequency representing a light grazing treatment.
Table 2. First Hollow Stem (FHS) results for each wheat variety collected at Chickasha. Plots were planted on 9/25/2025, with all sections left unclipped (i.e., not grazed). The FHS threshold is 1.5 cm (5/8″ or approximately the diameter of a dime). Reported values represent the average of ten measurements per variety. Varieties that exceed the threshold are highlighted in red.
Contact your local Extension office and us if you have questions.
Amanda de Oliveira Silva, Small Grains Extension Specialist
The first hollow stem stage indicates the beginning of stem elongation or just before the jointing stage. It is a good indicator of when producers should remove cattle from wheat pasture. This occurs when there is 1.5 cm (5/8”, or the diameter of a dime) of hollow stem below the developing grain head (see full explanation).
The latest FHS results from OSU forage trials in Stillwater (Table 1) and Chickasha (Table 2) are listed below. For an additional resource and wheat update on FHS, see the Mesonet First Hollow Stem Advisor.
OSU Small Grains Program monitors FHS occurrence on a twice-per-week basis
As in previous years, we will continue monitoring FHS occurrence in our wheat plots at Stillwater and Chickasha and share updates on this blog. In past years, our forage trials—where FHS samples are collected—were seeded early to simulate a grazed system, though forage was not removed. This method created an accelerated growth environment, allowing us to identify the earliest onset of FHS. Varieties that reach FHS earliest in these trials should be closely monitored in commercial fields.
This year, we are continuing with a new approach by simulating grazing with a mower in the forage trial in Stillwater. This will allow us to compare whether varieties reach FHS at different times when grazed versus non-grazed. We hypothesize that the simulated grazing treatment will likely delay FHS relative to the non-grazed treatment, with FHS differences among varieties becoming less pronounced. We also hypothesize that the amount of delay will vary among varieties, such that an early-FHS variety in the non-grazed environment may appear more intermediate in its FHS arrival with canopy removal. This comparison will provide insight into how canopy removal from grazing impacts the timing of reproductive development.
The latest FHS results for each variety planted in our forage trials at Stillwater and Chickasha are summarized below (Tables 1 and 2). Most varieties are still well below the 1.5 cm FHS threshold.
Table 1. First Hollow Stem (FHS) results for each wheat variety collected at Stillwater. Plots were planted on 10/10/2025, with one section left unclipped and the other clipped to simulate grazing. The FHS threshold is 1.5 cm (5/8″ or approximately the diameter of a dime). Reported values represent the average of ten measurements per variety. Varieties that exceed the threshold are highlighted in red. For the simulated grazing, plots were mowed on January 2nd and 13th, and on February 9th and 16th at a 3” cutting height, with the frequency representing a light grazing treatment.
Table 2. First Hollow Stem (FHS) results for each wheat variety collected at Chickasha. Plots were planted on 9/25/2025, with all sections left unclipped (i.e., not grazed). The FHS threshold is 1.5 cm (5/8″ or approximately the diameter of a dime). Reported values represent the average of ten measurements per variety. Varieties that exceed the threshold are highlighted in red.
Contact your local Extension office and us if you have questions.
Amanda de Oliveira Silva, Small Grains Extension Specialist, Oklahoma State University
The Oklahoma wheat harvest was delayed in many areas this year due to frequent rainfall events. I have received several questions about sprouted wheat seeds and potential issues with post-harvest dormancy, especially when using that grain for seed this fall. So, I would like to share a few considerations.
Pre-harvest sprouting
Pre-harvest sprouting refers to wheat grains that begin to germinate while still on the wheat head, before harvest. Once wheat reaches physiological maturity, it can begin to germinate if exposed to ideal moisture and warm temperatures for just a few days. That is what happened in some locations in northcentral OK this season.
The risk of sprouting depends on both genetics and environmental conditions. Wheat varieties differ in their resistance to sprouting (i.e., some are more prone to sprouting than others).
Can I use sprout-damaged wheat for seed?
It depends, especially on the level of sprouting.
If wheat kernels appear swollen or with a cracked seed coat, but with no visible root or shoot emerging from the seed, they might still be viable to be used as seed. In this case, run a germination test to assess seed quality before planting.
However, if you see visible roots or a developing coleoptile emerging from the seed (see Picture 1), those seeds should not be used. They will likely have poor viability and may fail to emerge.
Picture 1. Pre-harvest sprouted wheat damage, showing grain with split seed coat and radicle starting to become visible. The photo was taken on June 10, 2022 by Glen Calvert, former Extension Ag Educator at Washita County.
Will pre-harvest sprouting damage affect wheat quality?
Yes. As wheat starts to sprout (i.e., begins to germinate), it produces alpha-amylase and other enzymes that break down starch and protein in the grain. Increased enzyme activity can reduce flour and baking quality, affecting dough strength, loaf volume, and crumb structure. The more severe the sprouting, the greater the loss in marketability and end-use quality.
Post-harvest seed dormancy
Since harvest was late this year, will post-harvest dormancy affect planting this fall?
It is possible. Wheat seed is considered dormant when it fails to germinate even under favorable conditions or take so long that emergence is delayed, thus causing poor stands. Dormancy can be worsened when planting in warm soil (above 70F), which is typical during early sowing of graze-out or dual-purpose systems in Oklahoma.
Some level of seed dormancy is beneficial as it helps prevent pre-harvest sprouting as previously discussed. Dormancy is highest right before harvest and gradually decreases over time. But the rate at which it decreases depends on genetics and several other factors, including:
Seed coat properties: Inhibitory compounds in the seed coat of hard red winter wheat varieties can extend post-harvest dormancy.
Storage conditions: Seed stored at extreme temperatures (hot or cold) tend to lose dormancy faster than those stored at ambient air temperatures. This is why placing seed samples in a refrigerator for a day or two before conducting germination tests is a common practice.
Grain-fill environment: Cooler and wetter conditions during grain fill result in stronger dormancy than hot and dry conditions during this period. This means that the same wheat variety may exhibit different germination behavior depending on the environment in which the seed was produced.
For most hard red winter wheat varieties, dormancy naturally dissipates by October. However, early sowing shortens the interval between harvest and planting, which increases the risk of planting dormant seed, leading to delayed emergence and poor stands.
Dormancy can be mistaken by other problems like dead or damaged seeds. Running a germination test can help to identify what is going on.
What to check before planting saved seed:
Germination Test
Even if the grain didn’t visibly sprout in the head, it may have undergone internal changes (like enzyme activity) that reduce vigor. A standard germination test is the best way to assess viability.
Prolonged wet conditions during grain filling and harvest can lead to seed-borne fungal diseases. These can reduce seed quality and emergence. Consider using a fungicide seed treatment to reduce this risk.
3. Test weight and shrunken kernels
Low test weight and shriveled seeds often indicate poor grain fill. These seeds might have reduced starch reserves, which weakens seedling growth.
Aim for test weight above 58 lb/bu for seed use.
Summary
Delayed harvest increases the risk of pre-harvest sprouting.
Both can impact seed viability and plant emergence this fall.
Before using your own grain as seed, be sure to run a germination test and assess overall seed quality.
Resources:
If you have questions about testing, seed treatment, or variety selection, feel free to reach out to your local Extension office or to me.
Oklahoma wheat harvest has been moving at a fast pace the last two days. Several producers and custom harvesters wrapping up in Southwest, Oklahoma. Great strides also have been made in central and far western regions of the state. Producers are cutting in all regions even in the North Central, I-35 corridor on the Oklahoma/Kansas line. (Producers continue to battle mud from heavy rains in Northern, Oklahoma from Kremlin to the Blackwell/Ponca City, Braman region. Mud is also giving producers challenges in the Afton and Miami area.) It should be noted several locations from all central regions to most northern regions have several fields that are partially harvested with producers and harvesters planning to come back for the wetter lower lying areas. Rain has also hindered progress on some of the dryland wheat areas in the Panhandle that was received on Monday evening. **Test weights across the state have dropped due to all the heavy rains last week, but statewide we are still looking at a 59 lb. per bushel average despite some lower test weights reported based on location and variety. Yields across the state are being reported from the mid 30’s to mid 50’s for the most part. Producers with management intensive plans have been reporting yields in the mid 60’s to low 80’s. Protein across the state averaging 11.1%. The Oklahoma Wheat Commission is calling harvest 55% completed as of today. The next harvest report will be published on June 30, 2025.
**It should be noted in locations between Wichita Falls, Texas, and Lawton, Oklahoma, many acres were flooded and those fields will never be harvested. The same statement applies to several locations around the Tonkawa, Blackwell, Ponca City region. It is predicted in these areas it will impact production by a 1/3 of what is normally taken in at these locations. Weeds also a bigger issue in these fields as producers have not been able to get to them in time to harvest.
Southwest and Western Oklahoma-
Walters/Temple/Ahpeatone/Ryan/Hulen–Harvest has made great progress in this region over the past 5 days. Despite lower test weights due to rains last week, these locations looking at 58 lb. to 59lb. averages for the region. Yields are ranging all over the board from 20 bushels per acre to 40 bushels per acre, with some higher yields noted on earlier cuttings. Protein averaging 11.9%. It should be noted this region will take in 1/3 less than the five year average due to excessive flooding on wheat that will never be harvested.This region is 95% harvested.
Carter/Brinkman/Altus/Lone Wolf– Test weights have dropped some but this region still looking at 59 lbs. per bushel average test weight for the entire harvest. Yields being reported in the mid 30’s to mid 40’s, with some intensively managed wheat reported to be making in the low 50’s to mid 60’s. Proteins averaging 11.2%. These regions are 97% harvested.
Hobart- This area has not moved along as fast due to heavier rains at times earlier in the season. Test weights averaging 59 lbs. per bushel for the location. Yields ranging in the mid 30’s to mid 50’s with some management intensive wheat making in the high 70’s to low 80’s. Protein is averaging 11.2%.This region reported to be 90% harvested.
Gotebo-This area has not moved along as fast due to heavier rains at times. Test weights averaging 58 lbs. per bushel. Yields ranging from mid 30’s to mid 50’s. Protein is averaging 11.2%.This region is 60% harvested.
Sentinel/Rocky-Producers have made great progress in these regions. Test weights for the entire region averaging 59 lbs. per bushel. Early yields reported in the mid 30’s to mid 40’s on heavily grazed wheat. As producers get further into harvest the yields have gotten better in the mid 40’s to low 50’s in some instances. Protein averaging 11.8%. The Sentinel region is 95% harvested, the Rocky region has received more rain and is 85% completed.
Central Oklahoma
Greenfield-Harvest in this region has made great progress. Test weights ranging from 58.5 lbs. to 62 lbs. per bushel depending on variety and location. Yields being reported from the mid 40’s to mid 60’s, with even some higher yields on management intensive wheat. Protein ranging from 10.7% to 11.1%.This area being reported as 75 percent harvested.
Okarche/Piedmont – Producers making progress in this region but still continue to fight mud. Test weights now averaging 59 lbs. for the region. Yield averages reported in the mid 40’s with some management intensive wheat reported to be making in the mid 50’s to low 60’s. Protein is varying in this region, but East of Okarche into Piedmont region several higher proteins being reported above 12%.This region is 70% harvested.
Kingfisher/Omega/Loyal/Reeding – Some lower test weights now coming in the region. The area still looking at 58 lb. per bushel to 59 lb. per bushel average for the region. Yields ranging in the mid 30’s to mid 50’s depending on management practices. Several producers have grazed heavily in this region which has impacted yield. Producers that did not graze heavily with management intensive plans reporting yields in the mid 50’s to mid 60’s. Proteins ranging from 10.5% to 11.2%. The Kingfisher, Reeding and Omega locations are 70 percent complete. Loyal locations are 65% completed.
North Central and Northern Oklahoma
Okeene/Fairview/Ringwood/Lahoma- Producers in the Fairview, Ringwood and Lahoma region seem to be further ahead than in the region West of Okeene. Test weights still coming in above 60 lbs. per bushel in several of these locations. Yields ranging from the mid 40’s to mid 50’s for the most part, with intensive management fields making 60 to 80 bushels. Protein reports are varying across this area with lower than expected proteins in some areas and much higher than expected proteins in other parts. The protein average in this region is at 11.5%.The Fairview/Ringwood/Lahoma areas are reported at 60% complete, the Okeene region going west is reported at 40% harvested.
McWillie/Helena/Goltry- Producers in McWillie/Helena area made great progress this past 5 to 6 days. Test weights still averaging 60 lbs. per bushel on later cuttings. Yields ranging from high 30’s to mid 50’s depending on management practices. Some intensively managed wheat reported to be making in the mid 60’s. No protein was reported at this time.This region is considered to be 70% harvested.
Kremlin/Hunter/Pond Creek-Producers continue to make progress in this region while still fighting mud. Test weights are still holding up remarkably well with ranges from 58 lbs. to 61 lbs. per bushel depending on location and variety. Yields reported in the mid 40’s to mid 50’s on these early cuttings for the most part. Some intensively managed fields making in the mid 60’s. Protein averaging 11.2%. This region is considered to be 35% harvested.
Tonkawa/Ponca City/Blackwell/Braman–Great progress has been made the last couple days in the area, but producers still fighting mud. Test weights being reported at 58 lbs. to 59 lbs. per bushel. This region has had extremely heavy rains and for test weights to be holding at these averages is a welcome surprise. Yields on early cuttings ranging from low 40’s to mid 50’s for the most part. It should be noted that a large area in this region has either suffered severe flooding and hail events. Also several fields will most likely be abandoned due to heavy weed issues. Protein on early cuttings averaging 11.1%. This region is considered 25% harvested.
Northwest Oklahoma
Shattuck/Comargo- Producers have made great strides in this region over the last 5 days. Yields reported as making in the low 30’s to mid 40’s. This area has also been heavily grazed and for this reason yields are a bit lower. Test weights coming in at 60 lbs. or higher. Protein averaging 11.1%.This region is considered to be 75% harvested.
Burlington- Producers have made great strides in this region over the last 5 days. Yields being reported from mid 50’s to mid 60’s for the most part. Some intensively managed production making in the mid 80’s. Test weights averaging 60 or above. Protein reported at 11.1%. This region is considered 75% harvested.
Northeast Oklahoma
Afton/Miami- Producers have made great progress the last couple of days, still fighting extremely muddy conditions. This region reporting two classes — Hard Red Winter and Soft Red Winter wheat. This region reported at 30% percent complete.
**Hard Red Winter Class, test weights have been averaging 55 lbs. per bushel. Yields are ranging in the mid 20’s to mid 50’s depending on variety and location.
**Soft Red Winter Class, test weights have been averaging 56 lbs. to 58 lbs. per bushel. Yields are ranging in the mid 20’s to mid 50’s depending on variety and location.
Wheat Classes And What They Are Used For
Hard Red Winter (HRW) – A versatile wheat with excellent milling and baking characteristics for pan bread. Hard Red Winter wheat is also a choice for Asian noodles, hard rolls, flat breads, general purpose flour and cereal.
Soft Red Winter (SRW)– A versatile, weak-gluten wheat with excellent milling and baking characteristics suited for cookies, crackers, pretzels, pastries and flat breads.
Panhandle
Texhoma/Goodwell/Guymon/Hooker-A large portion of dryland harvest has taken place over the past week in the Panhandle. Yields on dryland wheat ranging from 20 bushels per acre to 50 bushels per acre depending on variety and location. Test weights on dryland wheat ranging from 55 lbs. to 61 lbs. per bushel depending on variety and location. Proteins averaging 11.5% for the region. Heavy rains on Monday evening hindered harvest in some locations on Tuesday, but producers are hopeful to get back in the fields today. At the time of this report, no irrigated wheat has been reported as being harvested. It is thought producers will start getting into irrigated wheat the end of this week. The dryland wheat in this region is considered 70 to 75% harvested depending on location.
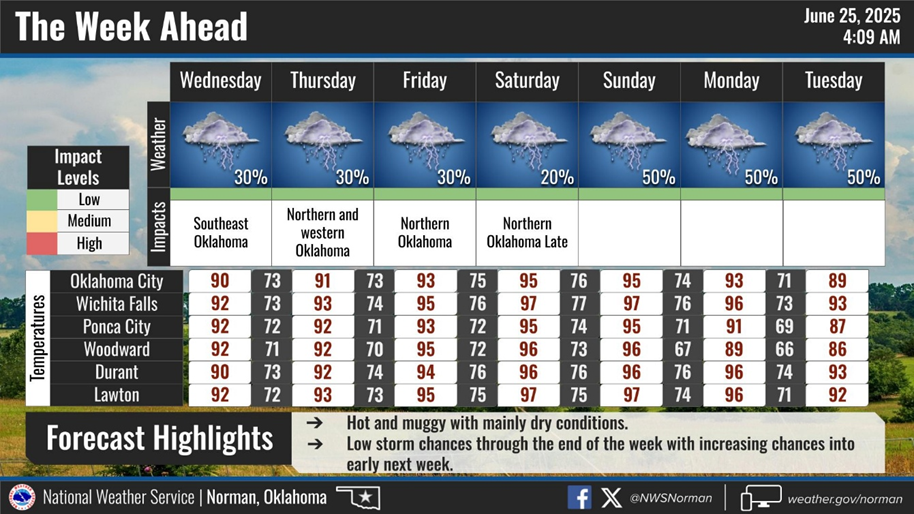
Below, see the 7-day forecast provided by the Oklahoma Mesonet.
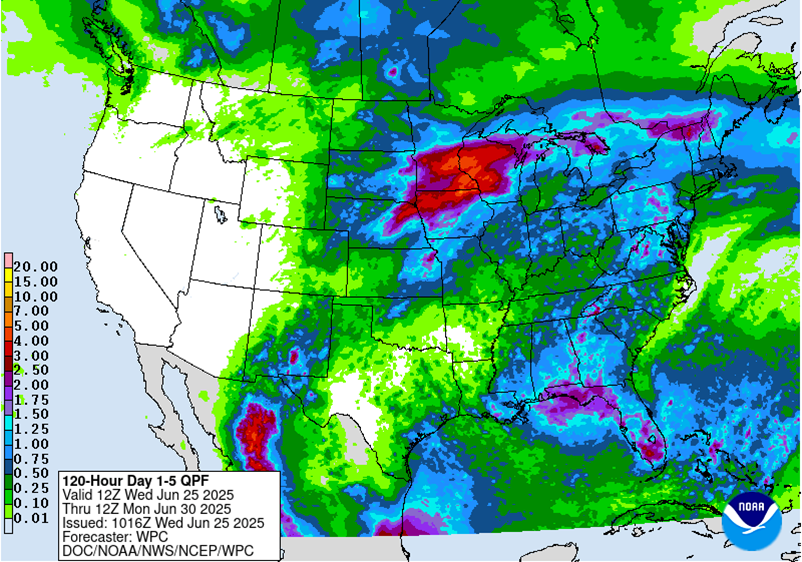
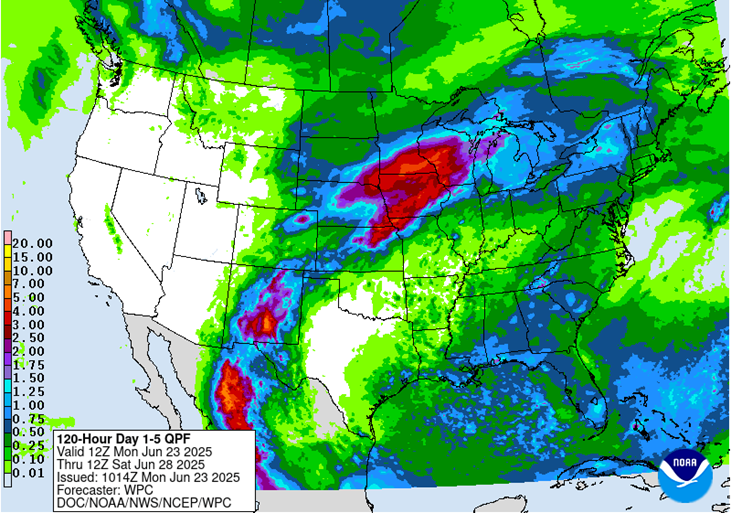
NWS Days 1-5 Precipitation Forecast
The Days 1-5 Precipitation Forecast is produced by the National Weather Service’s Weather Prediction Center for June 25-30, 2025.
Oklahoma wheat harvest continues with producers making great strides despite fighting mud in several locations across central and Northern Oklahoma. **Test weights across the state have dropped due to all the heavy rains last week, but statewide we are still looking at a 59 lb. per bushel average despite some lower test weights reported based on location and variety. Yields across the state are being reported from the mid 30’s to mid 50’s for the most part. Producers with management intensive plans have been reporting yields in the mid 60’s to low 80’s. Protein across the state averaging 11.1%. Due to several locations making great progress in parts of Southwest, Central, and North Central, OK the OWC is calling harvest 37% completed at the time of this report. The next OWC harvest report will be published on Wednesday June 25, 2025.
Southwest and Western Oklahoma-
Walters/Temple/Ahpeatone/Ryan/Hulen–Harvest has made great progress in this region over the past 5 days. Despite lower test weights due to rains last week, these locations looking at 58 lb. to 59lb. averages for the region. Yields are ranging all over the board from 20 bushels per acre to 40 bushels per acre, with some higher yields noted on earlier cuttings. Protein averaging 11.9%. It should be noted this region will take in 1/3 less than the five year average due to excessive flooding on wheat that will never be harvested.This region is 90% harvested.
Carter/Brinkman/Altus/Lone Wolf– Test weights have dropped some but this region still looking at 59 lbs. per bushel average test weight for the entire harvest. Yields being reported in the mid 30’s to mid 40’s, with some intensively managed wheat reported to be making in the low 50’s to mid 60’s. Proteins averaging 11.2%. These regions are 95% harvested.
Hobart- This area has not moved along as fast due to heavier rains at times earlier in the season. Test weights averaging 59 lbs. per bushel for the location. Yields ranging in the mid 30’s to mid 50’s with some management intensive wheat making in the high 70’s to low 80’s. Protein is averaging 11.2% Several reports from producers also show good wheat in this region if they are just able to get into the fields to get it harvested. This region reported to be 70% harvested.
Gotebo-This area has not moved along as fast due to heavier rains at times. Test weights averaging 58 lbs. per bushel. Yields ranging from mid 30’s to mid 50’s. Protein is averaging 11.2%. This region is 40% harvested.
Sentinel/Rocky-Producers have made great progress in these regions. Test weights for the entire region averaging 59 lbs. per bushel. Early yields reported in the mid 30’s to mid 40’s on heavily grazed wheat. As producers get further into harvest the yields have gotten better in the mid 40’s to low 50’s in some instances. Protein averaging 11.8%.The Sentinel region is 95% harvested, the Rocky region has received more rain and is 70% completed.
Central Oklahoma
Greenfield-Harvest in this region has made great progress on sandier ground over the weekend. Test weights ranging from 58.5 lbs. to 62 lbs. per bushel depending on variety and location. Yields being reported from the mid 40’s to mid 60’s, with even some higher yields on management intensive wheat. Protein ranging from 10.7% to 11.1%. This area being reported as 50 percent harvested.
Okarche/Piedmont –Producers making progress in this region but have really been fighting mud over the weekend which has hindered the ability for many to get back into fields. Test weights now averaging 59 lbs. for the region. Yield averages reported in the mid 40’s with some management intensive wheat reported to be making in the mid 50’s to low 60’s. Protein is varying in this region, but East of Okarche into Piedmont region several higher proteins being reported above 12%.This region is 50 percent harvested.
Kingfisher/Omega/Loyal/Reeding – Some lower test weights now coming in the region. The area still looking at 58 lb. per bushel to 59 lb. per bushel average for the region. Yields ranging in the mid 30’s to mid 50’s depending on management practices. Several producers have grazed heavily in this region which has impacted yield. Producers that did not graze heavily with management intensive plans reporting yields in the mid 50’s to mid 60’s. Proteins ranging from 10.5% to 11.2%. The Kingfisher region is 50 percent harvested, Omega location is 35% harvested, Loyal and Reeding locations are 30% completed.
North Central and Northern Oklahoma
McWillie/Helena/Goltry- Producers in McWillie/Helena area made great progress this past 5 to 6 days. Test weights still averaging 60 lbs. per bushel on later cuttings. Yields ranging from high 30’s to mid 50’s depending on management practices. Some intensively managed wheat reported to be making in the mid 60’s. No protein was reported at this time. This region is considered to be 50% harvested.
Kremlin/Hunter/Pond Creek-Producers have just gotten good starts over the weekend in this region and have been fighting mud. Test weights are still holding up remarkably well with ranges from 58 lbs. to 61 lbs. per bushel depending on location and variety. Yields reported in the mid 40’s to mid 50’s on these early cuttings for the most part. Some intensively managed fields making in the mid 60’s. Protein averaging 11.2%. This region considered to be 20% harvested.
Tonkawa/Ponca City/Blackwell/Braman– This region just getting a good start over the weekend. Test weights being reported at 58 lbs. to 59 lbs. per bushel. This region has had extremely heavy rains and for test weights to be holding at these averages is a welcome surprise. Yields on early cuttings ranging from low 40’s to mid 50’s for the most part. It should be noted that a large area in this region has either suffered severe flooding and hail events. Also several fields will most likely be abandoned due to heavy weed issues. Protein on early cuttings averaging 11.1%. This region is considered 8% harvested.
Northwest Oklahoma
Shattuck/Comargo- Producers have made great strides in this region over the last 5 days. Yields reported as making in the low 30’s to mid 40’s. This area has also been heavily grazed and for this reason yields are a bit lower. Test weights coming in at 60 lbs. or higher. Protein averaging 11.1% This region is considered to be 60% harvested.
Burlington- Producers have made great strides in this region over the last 5 days. Yields being reported from mid 50’s to mid 60’s for the most part. Some intensively managed production making in the mid 80’s. Test weights averaging 60 or above. Protein reported at 11.1%. This region is considered 60% harvested.
Northeast Oklahoma
Afton/Miami- Producers are just getting into fields over the weekend in this region. They have had to fight heavy rains and extremely muddy conditions. This region reporting two classes — Hard Red Winter and Soft Red Winter wheat. This region reported at 5 percent complete.
**Hard Red Winter Class, test weights have been averaging 55 lbs. per bushel. Yields are ranging in the mid 20’s to mid 50’s depending on variety and location.
**Soft Red Winter Class, test weights have been averaging 56 lbs. to 58 lbs. per bushel. Yields are ranging in the mid 20’s to mid 50’s depending on variety and location.
Wheat Classes And What They Are Used For
Hard Red Winter (HRW) – A versatile wheat with excellent milling and baking characteristics for pan bread. Hard Red Winter wheat is also a choice for Asian noodles, hard rolls, flat breads, general purpose flour and cereal.
Soft Red Winter (SRW)– A versatile, weak-gluten wheat with excellent milling and baking characteristics suited for cookies, crackers, pretzels, pastries and flat breads.
Panhandle
Texhoma/Goodwell/Guymon/Hooker-A large portion of dryland harvest has taken place over the past week in the Panhandle. Yields on dryland wheat ranging from 20 bushels per acre to 50 bushels per acre depending on variety and location. Test weights on dryland wheat ranging from 55 lbs. to 61 lbs. per bushel depending on variety and location. Proteins averaging 11.5% for the region. At the time of this report, no irrigated wheat has been reported as being harvested. It is thought producers will start getting into irrigated wheat the end of this week. The dryland wheat in this region is considered 50 percent harvested.
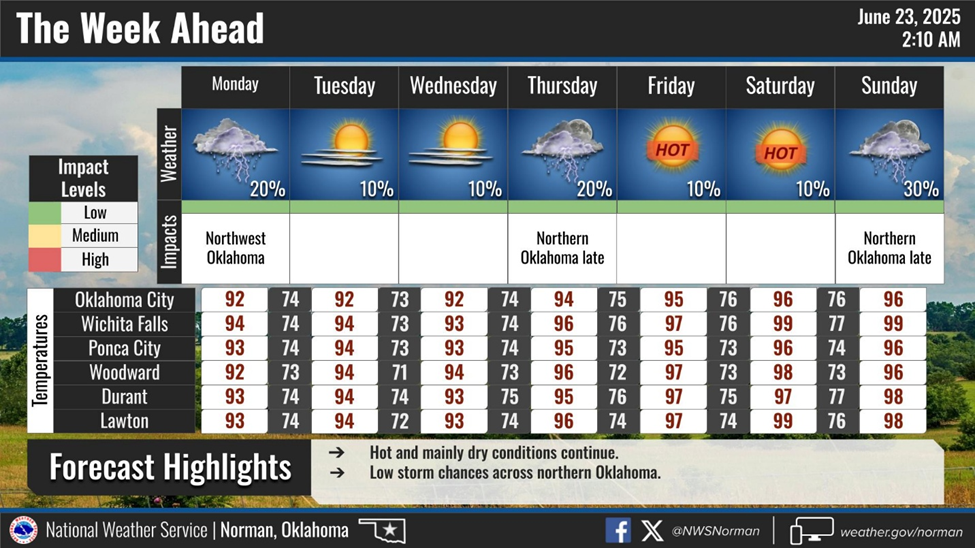
Below, see the 7-day forecast provided by the Oklahoma Mesonet.
NWS Days 1-5 Precipitation Forecast
The Days 1-5 Precipitation Forecast is produced by the National Weather Service’s Weather Prediction Center for June 23-28, 2025.