Oklahoma wheat harvest is at a standstill across the state today. Some minor harvesting continued in parts of Southwest Oklahoma yesterday, but most places were rained out. Southwest of Altus and North of Altus got heavy rains that moved East causing large amounts of moisture in Grady County and locations further east of the I-35 corridor. Rains and high humidity also delayed harvest from taking place in Central Oklahoma. More rains continue to be predicted starting tomorrow through the weekend across western Oklahoma. The next Oklahoma harvest report will be published on Monday, June 9, 2025.
There is no new harvest report at this time, as most locations have not seen any harvest activity since Monday. To view Monday’s report, please refer to my previous post.
Below, see the 7-day forecast provided by the Oklahoma Mesonet and the 5-day precipitation forecast along with Monday and Tuesday storm potentials.
NWS Days 1-5 Precipitation Forecast
The Days 1-5 Precipitation Forecast is produced by the National Weather Service’s Weather Prediction Center for June 4-9, 2025. See 2-Day Rainfall Accumulation (inches) measured by Oklahoma Mesonet.
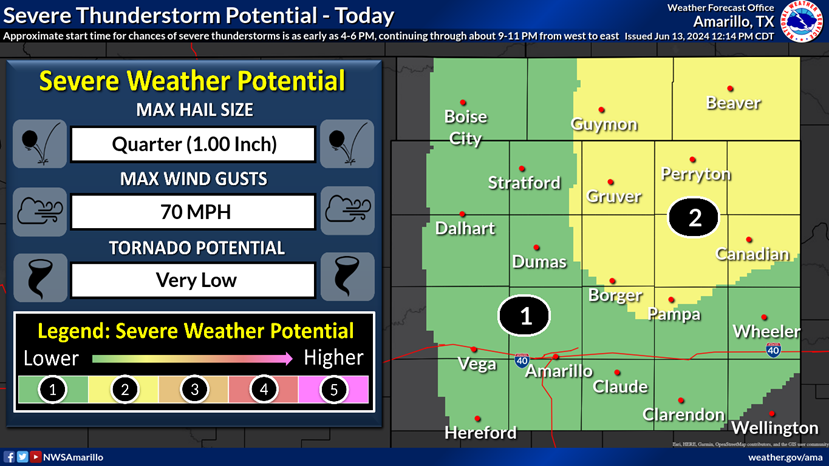
Severe Weather Potential Indications for Thursday and Friday this week!
Amanda de Oliveira Silva, Small Grains Extension Specialist
The first hollow stem stage indicates the beginning of stem elongation or just before the jointing stage. It is a good indicator of when producers should remove cattle from wheat pasture. This occurs when there is 1.5 cm (5/8”, or the diameter of a dime) of hollow stem below the developing grain head (see full explanation).
The latest FHS results from OSU forage trials in Stillwater (Table 1) and Chickasha (Table 2) are listed below. For an additional resource and wheat update on FHS, see the Mesonet First Hollow Stem Advisor.
OSU Small Grains Program monitors FHS occurrence on a twice-per-week basis
As in previous years, we will continue monitoring FHS occurrence in our wheat plots at Stillwater and Chickasha and share updates on this blog. In past years, our forage trials—where FHS samples are collected—were seeded early to simulate a grazed system, though forage was not removed. This method created an accelerated growth environment, allowing us to identify the earliest onset of FHS. Varieties that reach FHS earliest in these trials should be closely monitored in commercial fields.
This year, we are introducing a new approach by simulating grazing with a mower in the forage trial in Stillwater. This will allow us to compare whether varieties reach FHS at different times when grazed versus non-grazed. We hypothesize that the simulated grazing treatment will likely delay FHS relative to the non-grazed treatment, with FHS differences among varieties becoming less pronounced. We also hypothesize that the amount of delay will vary among varieties, such that an early-FHS variety in the non-grazed environment may appear more intermediate in its FHS arrival with canopy removal. This comparison will provide insight into how canopy removal from grazing impacts the timing of reproductive development.
The latest FHS results for each variety planted in our forage trials at Stillwater and Chickasha are summarized below (Tables 1 and 2). All varieties have reached the FHS threshold in Chickasha and Stillwater.
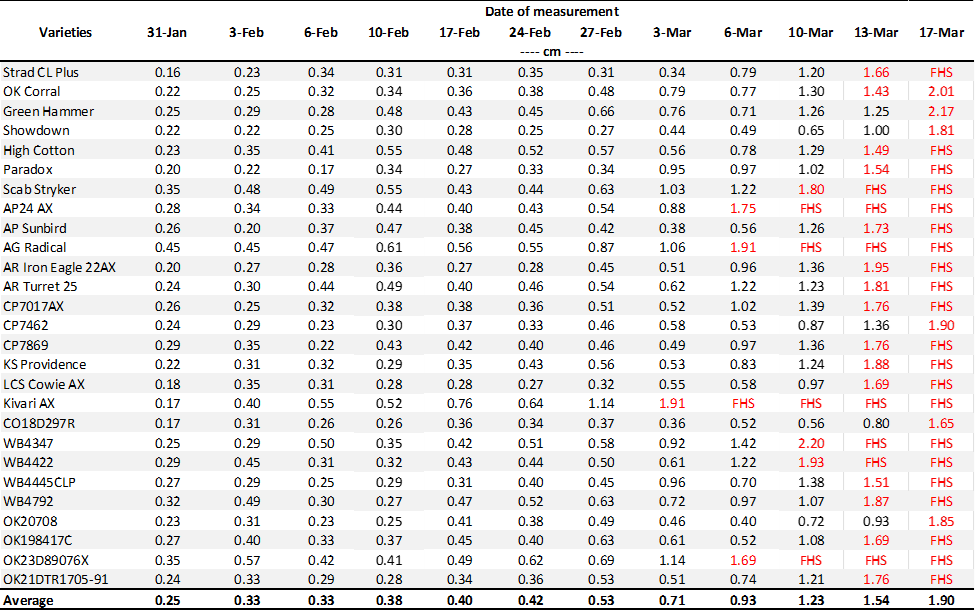
Table 1. First Hollow Stem (FHS) results for each wheat variety collected at Stillwater. Plots were planted on 10/11/24, with one section left unclipped and the other clipped to simulate grazing. The FHS threshold is 1.5 cm (5/8″ or approximately the diameter of a dime). Reported values represent the average of ten measurements per variety. Varieties that exceed the threshold are highlighted in red. For the simulated grazing, plots were mowed on January 3rd, 15th, 28th, February 10th, March 6th and 12th at a 2.5-3” cutting height, with the frequency representing a light grazing treatment.
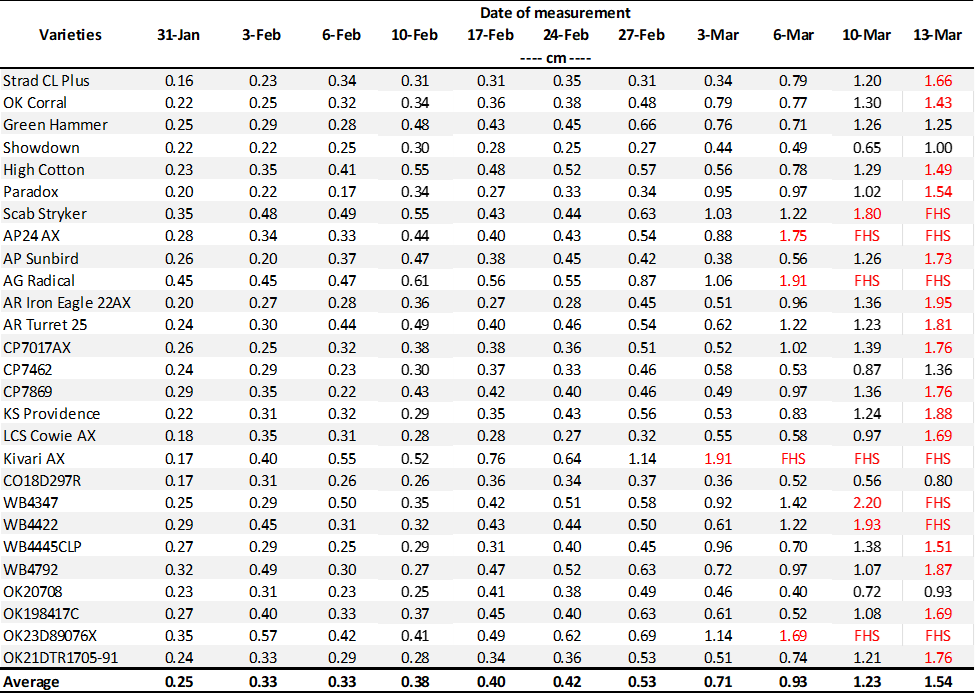
Table 2. First Hollow Stem (FHS) results for each wheat variety collected at Chickasha. Plots were planted on 10/02/24, with all sections left unclipped (i.e., not grazed). The FHS threshold is 1.5 cm (5/8″ or approximately the diameter of a dime). Reported values represent the average of ten measurements per variety. Varieties that exceed the threshold are highlighted in red.
Contact your local Extension office and us if you have questions.
Amanda de Oliveira Silva, Small Grains Extension Specialist
The first hollow stem stage indicates the beginning of stem elongation or just before the jointing stage. It is a good indicator of when producers should remove cattle from wheat pasture. This occurs when there is 1.5 cm (5/8”, or the diameter of a dime) of hollow stem below the developing grain head (see full explanation).
The latest FHS results from OSU forage trials in Stillwater (Table 1) and Chickasha (Table 2) are listed below. For an additional resource and wheat update on FHS, see the Mesonet First Hollow Stem Advisor.
OSU Small Grains Program monitors FHS occurrence on a twice-per-week basis
As in previous years, we will continue monitoring FHS occurrence in our wheat plots at Stillwater and Chickasha and share updates on this blog. In past years, our forage trials—where FHS samples are collected—were seeded early to simulate a grazed system, though forage was not removed. This method created an accelerated growth environment, allowing us to identify the earliest onset of FHS. Varieties that reach FHS earliest in these trials should be closely monitored in commercial fields.
This year, we are introducing a new approach by simulating grazing with a mower in the forage trial in Stillwater. This will allow us to compare whether varieties reach FHS at different times when grazed versus non-grazed. We hypothesize that the simulated grazing treatment will likely delay FHS relative to the non-grazed treatment, with FHS differences among varieties becoming less pronounced. We also hypothesize that the amount of delay will vary among varieties, such that an early-FHS variety in the non-grazed environment may appear more intermediate in its FHS arrival with canopy removal. This comparison will provide insight into how canopy removal from grazing impacts the timing of reproductive development.
The latest FHS results for each variety planted in our forage trials at Stillwater and Chickasha are summarized below (Tables 1 and 2). All varieties have reached the FHS threshold in Chickasha. In Stillwater, all varieties have reached FHS in the non-grazed plots, with only two varieties yet to reach FHS in the simulated grazed plots.
Table 1. First Hollow Stem (FHS) results for each wheat variety collected at Stillwater. Plots were planted on 10/11/24, with one section left unclipped and the other clipped to simulate grazing. The FHS threshold is 1.5 cm (5/8″ or approximately the diameter of a dime). Reported values represent the average of ten measurements per variety. Varieties that exceed the threshold are highlighted in red. For the simulated grazing, plots were mowed on January 3rd, 15th, 28th, February 10th, and March 6th at a 2.5-3” cutting height, with the frequency representing a light grazing treatment.
Table 2. First Hollow Stem (FHS) results for each wheat variety collected at Chickasha. Plots were planted on 10/02/24, with all sections left unclipped (i.e., not grazed). The FHS threshold is 1.5 cm (5/8″ or approximately the diameter of a dime). Reported values represent the average of ten measurements per variety. Varieties that exceed the threshold are highlighted in red.
Contact your local Extension office and us if you have questions.
Amanda de Oliveira Silva, Small Grains Extension Specialist
The first hollow stem stage indicates the beginning of stem elongation or just before the jointing stage. It is a good indicator of when producers should remove cattle from wheat pasture. This occurs when there is 1.5 cm (5/8”, or the diameter of a dime) of hollow stem below the developing grain head (see full explanation).
The latest FHS results from OSU forage trials in Stillwater (Table 1) and Chickasha (Table 2) are listed below. For an additional resource and wheat update on FHS, see the Mesonet First Hollow Stem Advisor.
OSU Small Grains Program monitors FHS occurrence on a twice-per-week basis
As in previous years, we will continue monitoring FHS occurrence in our wheat plots at Stillwater and Chickasha and share updates on this blog. In past years, our forage trials—where FHS samples are collected—were seeded early to simulate a grazed system, though forage was not removed. This method created an accelerated growth environment, allowing us to identify the earliest onset of FHS. Varieties that reach FHS earliest in these trials should be closely monitored in commercial fields.
This year, we are introducing a new approach by simulating grazing with a mower in the forage trial in Stillwater. This will allow us to compare whether varieties reach FHS at different times when grazed versus non-grazed. We hypothesize that the simulated grazing treatment will likely delay FHS relative to the non-grazed treatment, with FHS differences among varieties becoming less pronounced. We also hypothesize that the amount of delay will vary among varieties, such that an early-FHS variety in the non-grazed environment may appear more intermediate in its FHS arrival with canopy removal. This comparison will provide insight into how canopy removal from grazing impacts the timing of reproductive development.
The latest FHS results for each variety planted in our forage trials at Stillwater and Chickasha are summarized below (Tables 1 and 2). In Chickasha, all varieties have reached the FHS threshold, and in Stillwater, most varieties have reached FHS.
Table 1. First Hollow Stem (FHS) results for each wheat variety collected at Stillwater. Plots were planted on 10/11/24, with one section left unclipped and the other clipped to simulate grazing. The FHS threshold is 1.5 cm (5/8″ or approximately the diameter of a dime). Reported values represent the average of ten measurements per variety. Varieties that exceed the threshold are highlighted in red. For the simulated grazing, plots were mowed on January 3rd, 15th, 28th, February 10th, and March 6th at a 2.5-3” cutting height, with the frequency representing a light grazing treatment.
Table 2. First Hollow Stem (FHS) results for each wheat variety collected at Chickasha. Plots were planted on 10/02/24, with all sections left unclipped (i.e., not grazed). The FHS threshold is 1.5 cm (5/8″ or approximately the diameter of a dime). Reported values represent the average of ten measurements per variety. Varieties that exceed the threshold are highlighted in red.
Contact your local Extension office and us if you have questions.
Amanda de Oliveira Silva, Small Grains Extension Specialist
The first hollow stem stage indicates the beginning of stem elongation or just before the jointing stage. It is a good indicator of when producers should remove cattle from wheat pasture. This occurs when there is 1.5 cm (5/8”, or the diameter of a dime) of hollow stem below the developing grain head (see full explanation).
The latest FHS results from OSU forage trials in Stillwater (Table 1) and Chickasha (Table 2) are listed below. For an additional resource and wheat update on FHS, see the Mesonet First Hollow Stem Advisor.
OSU Small Grains Program monitors FHS occurrence on a twice-per-week basis
As in previous years, we will continue monitoring FHS occurrence in our wheat plots at Stillwater and Chickasha and share updates on this blog. In past years, our forage trials—where FHS samples are collected—were seeded early to simulate a grazed system, though forage was not removed. This method created an accelerated growth environment, allowing us to identify the earliest onset of FHS. Varieties that reach FHS earliest in these trials should be closely monitored in commercial fields.
This year, we are introducing a new approach by simulating grazing with a mower in the forage trial in Stillwater. This will allow us to compare whether varieties reach FHS at different times when grazed versus non-grazed. We hypothesize that the simulated grazing treatment will likely delay FHS relative to the non-grazed treatment, with FHS differences among varieties becoming less pronounced. We also hypothesize that the amount of delay will vary among varieties, such that an early-FHS variety in the non-grazed environment may appear more intermediate in its FHS arrival with canopy removal. This comparison will provide insight into how canopy removal from grazing impacts the timing of reproductive development.
The latest FHS results for each variety planted in our forage trials at Stillwater and Chickasha are summarized below (Tables 1 and 2). All varieties have reached the FHS threshold in Chickasha. In Stillwater, most varieties have reached FHS in the non-grazed plots, while those in the simulated grazed plots need a few more days.
Table 1. First Hollow Stem (FHS) results for each wheat variety collected at Stillwater. Plots were planted on 10/11/24, with one section left unclipped and the other clipped to simulate grazing. The FHS threshold is 1.5 cm (5/8″ or approximately the diameter of a dime). Reported values represent the average of ten measurements per variety. Varieties that exceed the threshold are highlighted in red. For the simulated grazing, plots were mowed on January 3rd, 15th, 28th, February 10th, and March 6th at a 2.5-3” cutting height, with the frequency representing a light grazing treatment.
Table 2. First Hollow Stem (FHS) results for each wheat variety collected at Chickasha. Plots were planted on 10/02/24, with all sections left unclipped (i.e., not grazed). The FHS threshold is 1.5 cm (5/8″ or approximately the diameter of a dime). Reported values represent the average of ten measurements per variety. Varieties that exceed the threshold are highlighted in red.
Contact your local Extension office and us if you have questions.
Amanda de Oliveira Silva, Small Grains Extension Specialist
The first hollow stem stage indicates the beginning of stem elongation or just before the jointing stage. It is a good indicator of when producers should remove cattle from wheat pasture. This occurs when there is 1.5 cm (5/8”, or the diameter of a dime) of hollow stem below the developing grain head (see full explanation).
The latest FHS results from OSU forage trials in Stillwater (Table 1) and Chickasha (Table 2) are listed below. For an additional resource and wheat update on FHS, see the Mesonet First Hollow Stem Advisor.
OSU Small Grains Program monitors FHS occurrence on a twice-per-week basis
As in previous years, we will continue monitoring FHS occurrence in our wheat plots at Stillwater and Chickasha and share updates on this blog. In past years, our forage trials—where FHS samples are collected—were seeded early to simulate a grazed system, though forage was not removed. This method created an accelerated growth environment, allowing us to identify the earliest onset of FHS. Varieties that reach FHS earliest in these trials should be closely monitored in commercial fields.
This year, we are introducing a new approach by simulating grazing with a mower in the forage trial in Stillwater. This will allow us to compare whether varieties reach FHS at different times when grazed versus non-grazed. We hypothesize that the simulated grazing treatment will likely delay FHS relative to the non-grazed treatment, with FHS differences among varieties becoming less pronounced. We also hypothesize that the amount of delay will vary among varieties, such that an early-FHS variety in the non-grazed environment may appear more intermediate in its FHS arrival with canopy removal. This comparison will provide insight into how canopy removal from grazing impacts the timing of reproductive development.
The latest FHS results for each variety planted in our forage trials at Stillwater and Chickasha are summarized below (Tables 1 and 2). Some varieties have reached the FHS threshold.
Table 1. First Hollow Stem (FHS) results for each wheat variety collected at Stillwater. Plots were planted on 10/11/24, with one section left unclipped and the other clipped to simulate grazing. The FHS threshold is 1.5 cm (5/8″ or approximately the diameter of a dime). Reported values represent the average of ten measurements per variety. Varieties that exceed the threshold are highlighted in red. For the simulated grazing, plots were mowed on January 3rd, 15th, 28th, February 10th, and March 6th at a 2.5-3” cutting height, with the frequency representing a light grazing treatment.
Table 2. First Hollow Stem (FHS) results for each wheat variety collected at Chickasha. Plots were planted on 10/02/24, with all sections left unclipped (i.e., not grazed). The FHS threshold is 1.5 cm (5/8″ or approximately the diameter of a dime). Reported values represent the average of ten measurements per variety. Varieties that exceed the threshold are highlighted in red.
Contact your local Extension office and us if you have questions.
Amanda de Oliveira Silva, Small Grains Extension Specialist
In recent years, we have received numerous questions about the potential yield losses associated with planting wheat later in the fall. Farmers often ask if variety selection or management practices, like adjusting seeding rates, should change when planting is delayed.
As weather patterns become more unpredictable, with fall droughts and floods causing planting delays, this topic has become even more critical. Additionally, the late harvest of summer crops like soybeans and cotton in double-cropping systems further pushes wheat planting into late fall. The rise of herbicide-resistant weeds has also led farmers to delay planting as they work to control late-fall emerging weeds culturally.
Recognizing these challenges, our program has focused on studying wheat performance under late planting conditions. We aim to:
Estimate potential yield penalties and understand the factors contributing to them when planting is delayed from October to December in north central Oklahoma.
Evaluate variety performance under late planting, particularly focusing on varieties with different maturity ranges.
Determine the need to adjust seeding rates as planting is delayed.
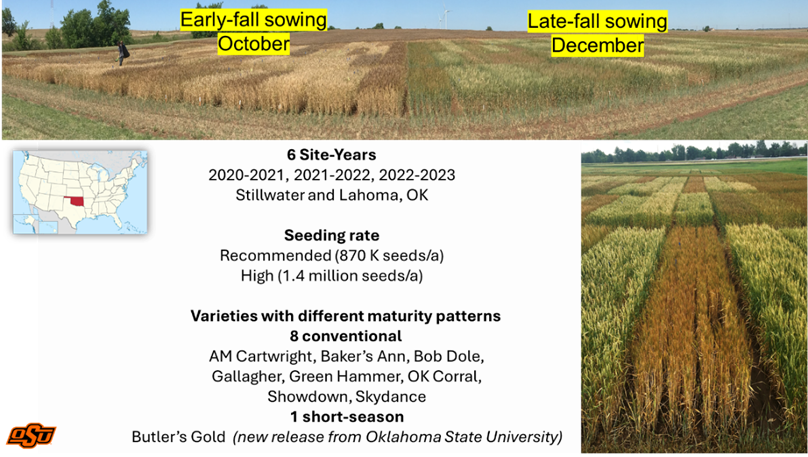
From 2021 to 2023, we conducted a study in Stillwater and Lahoma to evaluate how delaying planting dates from October to December would affect wheat performance (Figure 1). We tested two seeding rates, and nine winter wheat varieties adapted to Oklahoma, including a short-season variety covering a range of maturity classes (Table 1). The standard seeding rate of 870,000 seeds per acre reflects the average rate used in Oklahoma, equivalent to about 60 lbs/acre for wheat with an average seed size of 14,500 seeds per pound. To compensate for the approximately 40-day delay in planting between the October and December treatments, we increased the seeding rate by about 60%.
Figure 1. Treatment structure for field trials conducted in Stillwater and Lahoma during three growing seasons. All varieties but Butler’s Gold were released with the expected adoption at conventional planting dates.
Table 1. Information of historical maturity patterns of all varieties tested in this study at early-fall planting date.
Based on the data from this study, surprisingly, late-fall planting yields (79 bu/ac) exceeded early-fall planting yields (54 bu/ac) in four of six site-years, or by 5 bu/ac averaged across all site-years (Figure 2).
Figure 2. Grain yield for early-fall and late-fall planting dates averaged across nine varieties and two seeding rates for each site-year. Asterisks represent statistical differences between planting dates at p < 0.05.
Does delayed planting affect wheat development?
In our trials, late-fall planting was delayed by 41 days compared to early-fall planting. Wheat varieties planted later reached heading and maturity five days later than when planted earlier.
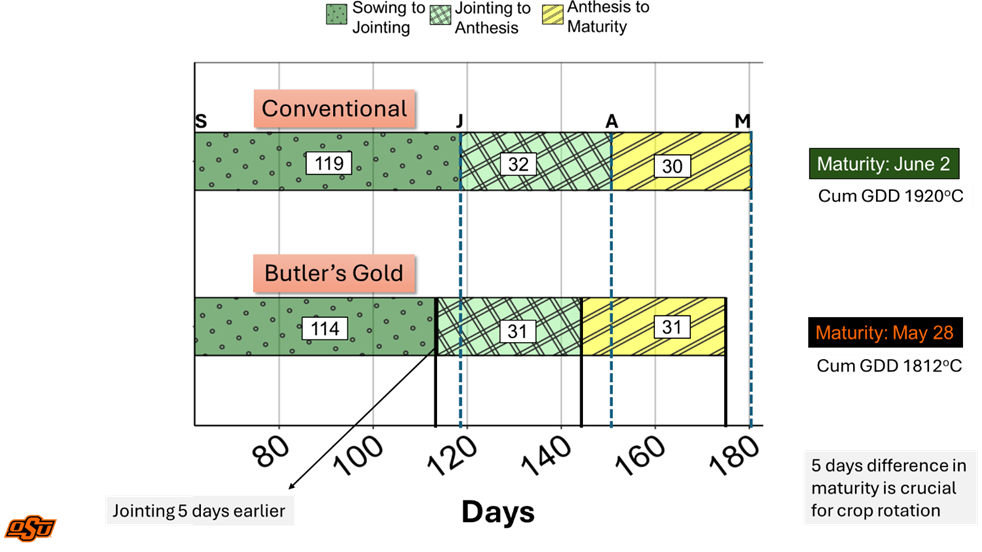
Late-fall planting reduced the period from planting to jointing by 28 days. The critical period from jointing to heading, which is vital for yield formation, was shortened by only seven days. The grain-filling period was shortened by only two days compared to early planting. Interestingly, varieties that reached jointing, heading, and maturity early at early-fall planting did so when planted late. For example, the variety Butler’s Gold reached jointing, heading, and maturity earlier than the other varieties in late-fall planting. Baker’s Ann followed closely, reaching these stages within the same day or up to three days later, while Bob Dole reached jointing and heading five days later and maturity six days later than Butler’s Gold.
Figure 3. Number of days from planting to jointing, jointing to anthesis, and anthesis to maturity between conventional and short-season varieties averaged across site-years.
Do wheat varieties perform similarly when planted late in the fall?
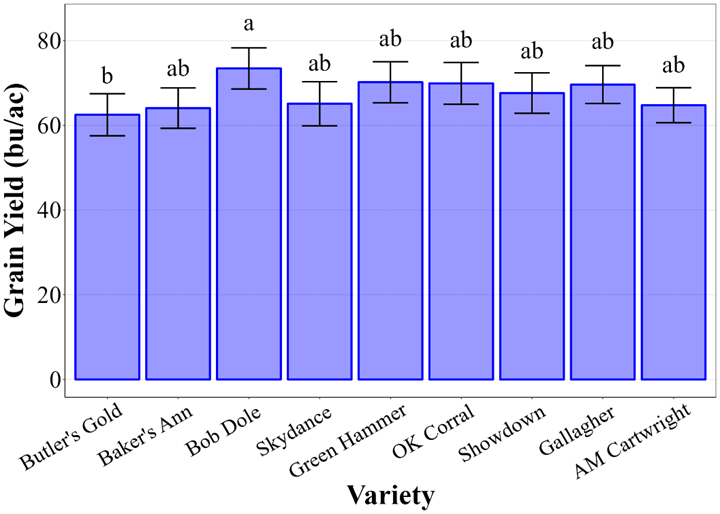
In our trials across multiple sites and seeding rates, Bob Dole was the top-yielding variety, producing 73 bu/ac in late-fall planting. However, its yield was not statistically higher than most other varieties tested, except for Butler’s Gold, which yielded 62 bu/ac (Figure 4). Varieties that performed well tended to accumulate more biomass by harvest and produced more grains per unit area (Figure 5).
A key observation was the trade-off between biomass production and maturity. Early maturing varieties like Butler’s Gold and Baker’s Ann had the lowest biomass production when planted late. This suggests that developing early maturing varieties with the ability to accumulate more biomass could improve their adaptability to late planting conditions. Further, the short-season variety Butler’s Gold had greater grain weight and above average grain protein concentration than the other varieties tested (Figure 5).
Figure 4. Average grain yield of nine varieties at late-fall planting date averaged over two seeding rates and six site-years. Plots with the same alphabetical letter are not statistically different from each other (p value < 0.05).Figure 5. Aboveground biomass (BM) at maturity, grain number per unit area, average grain weight (AGW) and grain protein concentration of nine varieties at late-fall planting date averaged over two seeding rates and six site-years. Plots with the same alphabetical letter are not statistically different from each other (p value < 0.05).
Does seeding rate need to be adjusted for delayed wheat planting?
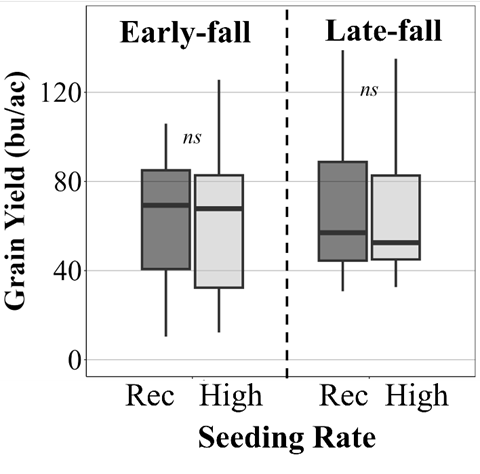
Our trials showed that increasing seeding rate did not result in a yield increase at late-fall planting across all varieties and site-years (Figure 6). Although the seeding rate affected some yield components, it did not translate into higher yields. The higher seeding rate increased the number of wheat heads per unit area but reduced the number of grains per head compared to the recommended seeding rate (data not shown). As a result, the total grain number per unit area — and ultimately the yield — remained the same for both seeding rates. Thus, our results suggest that increasing the seeding rate in late planting may not provide a yield advantage.
Figure 6. Grain yield under recommended (Rec.) and high seeding rates (i.e., 870K and 1.4 million seeds per acre, respectively) at early-fall (mid-October) and late-fall (early-December) planting dates averaged across nine genotypes and six site-years.
Take home • Late planted wheat in Oklahoma showed no consistent yield loss compared to early-fall planting • While the designated short-season variety, Butler’s Gold, did not outperform the other varieties at late sowing, its true value in a late-planted management system is derived from its one-week earlier harvest maturity. It also showed good end-use quality characteristics with heavier grain and above-average grain protein concentration than the other varieties . • Varieties with better biomass production and grain number performed better with late sowing. • Though this may defy logic, farmers do not need to increase seeding rate when facing the need to sow late, based on our results thus far.
Contributors: Israel Molina Cyrineu, PhD student Brett Carver, OSU Wheat Breeder Tyler Lynch, Senior Agriculturalist for the Small Grains Extension Program
This research has been partially supported by OSU Wheat Research Foundation and Oklahoma Wheat Commission
Wheat harvest is pretty-well wrapped up in all areas of the state but producers in the Panhandle still have had challenges on getting the irrigated wheat crop out as they have had more rains over the weekend that hindered them. It is thought that 35% to 40% of the crop within this region remains to be harvested. Test weights have dropped on the irrigated wheat from previous rain events, but overall statewide averages still look favorable. This will be the last harvest report of the season as the Oklahoma Wheat Commission is calling the state 97% complete with harvest.
General ReportAt the time of reporting today, test weights across the state were ranging from 56 to 64 lbs. per bushel, with lighter test weights in the Panhandle region due to the heavy rains over the past couple weeks. Statewide averages for test weights ranging from 60lbs. to 61 lbs. per bushel. Proteins ranging from 9% to 13.5% with an overall average of proteins being at 11.8% as of today. Yields being reported at 40 to 50 bushels per acre in most regions. Higher yields being reported on intensively managed wheat with some yields on a few fields being reported in the mid 60’s to low 80’s. Irrigated wheat in the Panhandle reported to be making 75 to 85 bushels per acre, with some higher yields noted in a few places. This will be the last harvest report of the season published by the Oklahoma Wheat Commission.
Statewide average numbers for Oklahoma
Statewide test weight average 60 lbs. to 61 lbs. per bushel
Statewide protein average 11.8%
Statewide yield average 40 to 45 bushels per acre
Below see the Tuesday evening Thunderstorm potential and rain chances for the Panhandle over the Independence Day weekend.
Oklahoma wheat harvest continues to move along in all areas of the state. Elevator locations reporting a lot of movement in all areas with many of the Southern and Central regions getting closer to the finish line. Great progress has also been made the last few days in North Central and Northeastern Oklahoma. Oklahoma Wheat Commission is calling wheat harvest for the state 75% complete.
Southwest and Western Oklahoma
Grandfield/Chattanooga/Lawton-Test weight have dropped slightly in all regions with some weights now coming in at 57lbs. to 59lbs. per bushel. It should be noted that some 60 lb. per bushel test weight wheat is still being taken in after rains. It has been reported by producers some varieties have certainly been better at holding test weights. (A large portion of this region was harvested before the heavy rains, so this area will still be looking at above 60 plus test weights for the harvest season.) Yields are still favorable ranging from the low 40’s to low 50’s. Protein averages being reported from 10.5% to 12%, with overall average at 11.0% to 11.2%. These locations reporting 95%complete.
Altus/Roosevelt/Lone Wolf/Hobart-A large amount of progress has been made the last couple of days but in some areas at the beginning of the week it was slower to start due to heavy rains. Test weights have dropped slightly this week but still holding a 60 plus average for the entire region. Yields reported as ranging from the low 40’s to mid 50’s. Some higher intensively managed wheat making in the low 60’s to low 70’s. Proteins in the region ranging from 9% to 14%. Protein average for the region coming in at 11.8%. These locations are reported at 85% complete.
Sentinel/Rocky-Harvest in the area has made further progress over the past few days. Test weights are still holding up ranging from 60lbs. to 62lbs. per bushel for the most part. Yields ranging from the mid 40’s to mid 50’s. Some highly intensive managed production have reports of some fields making in the 70’s. Proteins in this area are averaging 11.5% to 12%. These locations are reporting 96% complete
Central Oklahoma
El Reno- Harvest in this region made better progress over the past couple of days. Yields in the region ranging from the mid 40’s to the mid 50’s for the most part. Test weights averaging 60 lbs. per bushel and above. Proteins varying across the board from 9% to 13%. More higher than lower proteins reported for the region calling the average 11.5% to 12%. This location is reported at 90% complete.
Reeding/Kingfisher/Omega/Loyal/Okeene- Test weights ranging from 60 lbs. to 62 lbs. per bushel, as they have dropped slightly with the rains but overall are holding up. Yields ranging from mid 40’s to low 50’s for the most part. Some higher yields have been noted in low to mid 60’s on fields with some pushing 70 on wheat that was intensively managed. Protein ranging from 9% to 13.5%. Right now it is looking like an 11.0% to 11.8% average for the region. Harvest in the Kingfisher and Reeding locations reported at 95% complete. Harvest at Omega is 85% complete, Harvest in Loyal and Okeene considered 75% complete.
Northern Oklahoma
Kremlin/Hunter/Lamont- Harvest has made strong progress in this area over the past few days. Test weights ranging from 60lbs. to 62 lbs. per bushel. Yields ranging in the low 40’s to low 50’s for the most part. Fields with high management intensive systems being reported with yields as high as 70 bushels per acre, with some yields being reported in the high 80’s and low 90’s. The higher yields were management and variety dependent. Early reports on protein showing an 11.5% to 12% average. These locations reported at 70% complete.
Tonkawa/Blackwell/Ponca City-Harvest had good movement over the weekend in this region. Test weights have been favorable at 60lbs. per bushel and above. Yields being reported in the mid 40’s to mid 50’s for the most part. Protein being reported at 11.5% to 13.5%. These locations reported at 30% to 35% complete.
Burlington-A lot of movement took place in this area over the week. Test weights are ranging from 59lbs. to 62lbs. per bushel depending on variety. Most test weights are still 60lbs. per bushel and above. Yields in the region are ranging from the low 40’s to mid 50’s for the most part. Fields that struggled due to lack of rain earlier had been abandoned so those numbers are not reported in this report. It is expected custom harvesters will be pulling out of the area on Friday. Proteins being reported at 11.2% to 11.8%. This location is reported at 80% complete.
Camargo/Shattuck/Fort Supply- Producers also got rolling in these areas over the weekend. Much of this region had extreme drought conditions although the wheat in the Camargo area is reported to be doing better as they had more moisture over the season. Test weights reported at 61 lbs. per bushel and above. Yields being reported at 25 bushels per acre for the most part, but down by Camargo some higher yields around 40 bushels per acre have been reported. Proteins averaging 11% to 11.8%. These locations are reported at 35-40% complete.
Panhandle of Oklahoma
Turpin/Baker/Hooker- Producers have made good movement on dryland wheat in these regions, but are just getting a good start. It is thought irrigated wheat harvest will be a little slower than what was predicted earlier in the week, but right now producers are thinking harvest on irrigated wheat will be in 10 days. Dryland yields being reported from high 20’s to mid 40’s for the most part depending on rainfall and management practices. Test weights ranging from 60 lbs. to 61 lbs. per bushel. Proteins ranging from 12.5% to 13%. These locations reported at 15% complete.
Northeast Oklahoma
Afton/Miami- Harvest made good strides in the region this past week. Yields on the Hard Red Winter (HRW) reported at 50 to 70 bushels per acre. Yields on the Soft Red Winter (SRW) reported at 60 to 90 bushels per acre. Test weights ranging from 58 lbs. to 60 lbs. per bushel, with some higher test weights being reported as they get into better wheat. No proteins reported for the wheat in this area. In this region 40% of the production will be HRW and 60% will be SRW wheat.These locations reported at 50% complete.
Wheat Classes And What They Are Used For
Hard Red Winter (HRW) – A versatile wheat with excellent milling and baking characteristics for pan bread. Hard Red Winter wheat is also a choice for Asian noodles, hard rolls, flat breads, general purpose flour and cereal.
Soft Red Winter (SRW)– A versatile, weak-gluten wheat with excellent milling and baking characteristics suited for cookies, crackers, pretzels, pastries and flat breads.
General ReportAt the time of reporting today test weights were ranging from 58 to 64 lbs. per bushel for the most part. Most test weights are now ranging from 60lbs. to 61 lbs. per bushel across the state. Proteins ranging from 9% to 13.5%, with an overall average of proteins being at 11.8% as of today. Yields being reported at 40 to 50 bushels per acre in most regions. Higher yields being reported on intensively managed wheat with some yields on a few fields being reported in the mid 60’s to low 70’s. The Oklahoma Wheat Commission is calling the state 75% complete with harvest. The next Oklahoma Wheat Commission Harvest report will be published on Monday, June 17, 2024.
Below, see the 7-day forecast provided by the Oklahoma Mesonet, with storm alerts for the Panhandle and Northwestern Oklahoma for this Thursday afternoon/evening.