Amanda de Oliveira Silva, Small Grains Extension Specialist
The first hollow stem stage indicates the beginning of stem elongation or just before the jointing stage. It is a good indicator of when producers should remove cattle from wheat pasture. This occurs when there is 1.5 cm (5/8”, or the diameter of a dime) of hollow stem below the developing grain head (see full explanation).
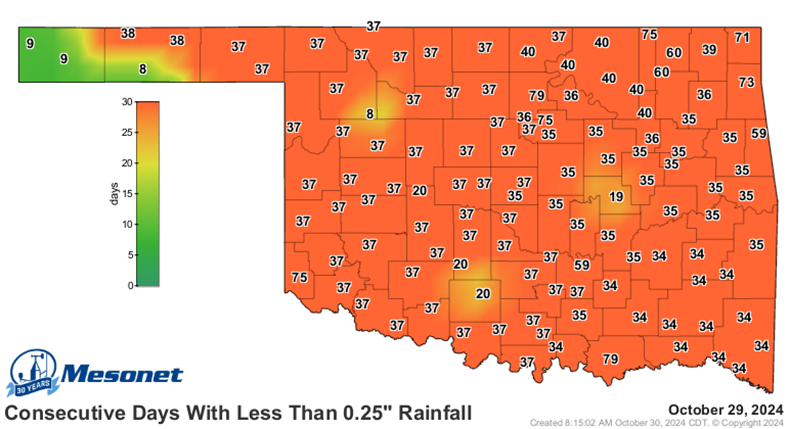
The latest FHS results from OSU forage trials in Stillwater (Table 1) and Chickasha (Table 2) are listed below. For an additional resource and wheat update on FHS, see the Mesonet First Hollow Stem Advisor.
OSU Small Grains Program monitors FHS occurrence on a twice-per-week basis
As in previous years, we will continue monitoring FHS occurrence in our wheat plots at Stillwater and Chickasha and share updates on this blog. In past years, our forage trials—where FHS samples are collected—were seeded early to simulate a grazed system, though forage was not removed. This method created an accelerated growth environment, allowing us to identify the earliest onset of FHS. Varieties that reach FHS earliest in these trials should be closely monitored in commercial fields.
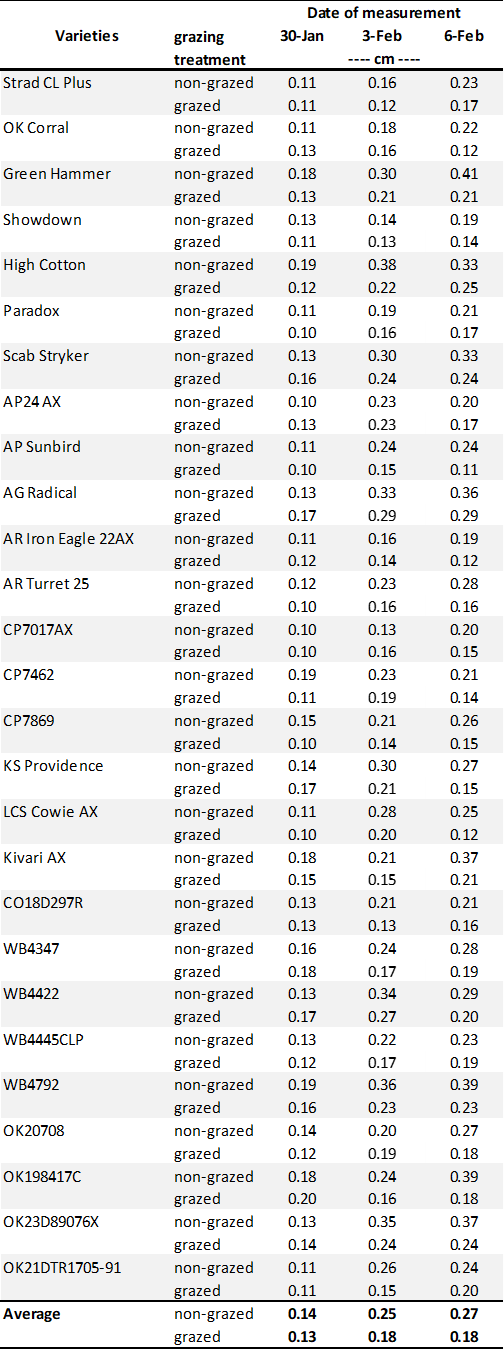
This year, we are introducing a new approach by simulating grazing with a mower in the forage trial in Stillwater. This will allow us to compare whether varieties reach FHS at different times when grazed versus non-grazed. We hypothesize that the simulated grazing treatment will likely delay FHS relative to the non-grazed treatment, with FHS differences among varieties becoming less pronounced. We also hypothesize that the amount of delay will vary among varieties, such that an early-FHS variety in the non-grazed environment may appear more intermediate in its FHS arrival with canopy removal. This comparison will provide insight into how canopy removal from grazing impacts the timing of reproductive development.
The latest FHS results for each variety planted in our forage trials at Stillwater and Chickasha are summarized below (Tables 1 and 2). Some varieties have reached the FHS threshold.
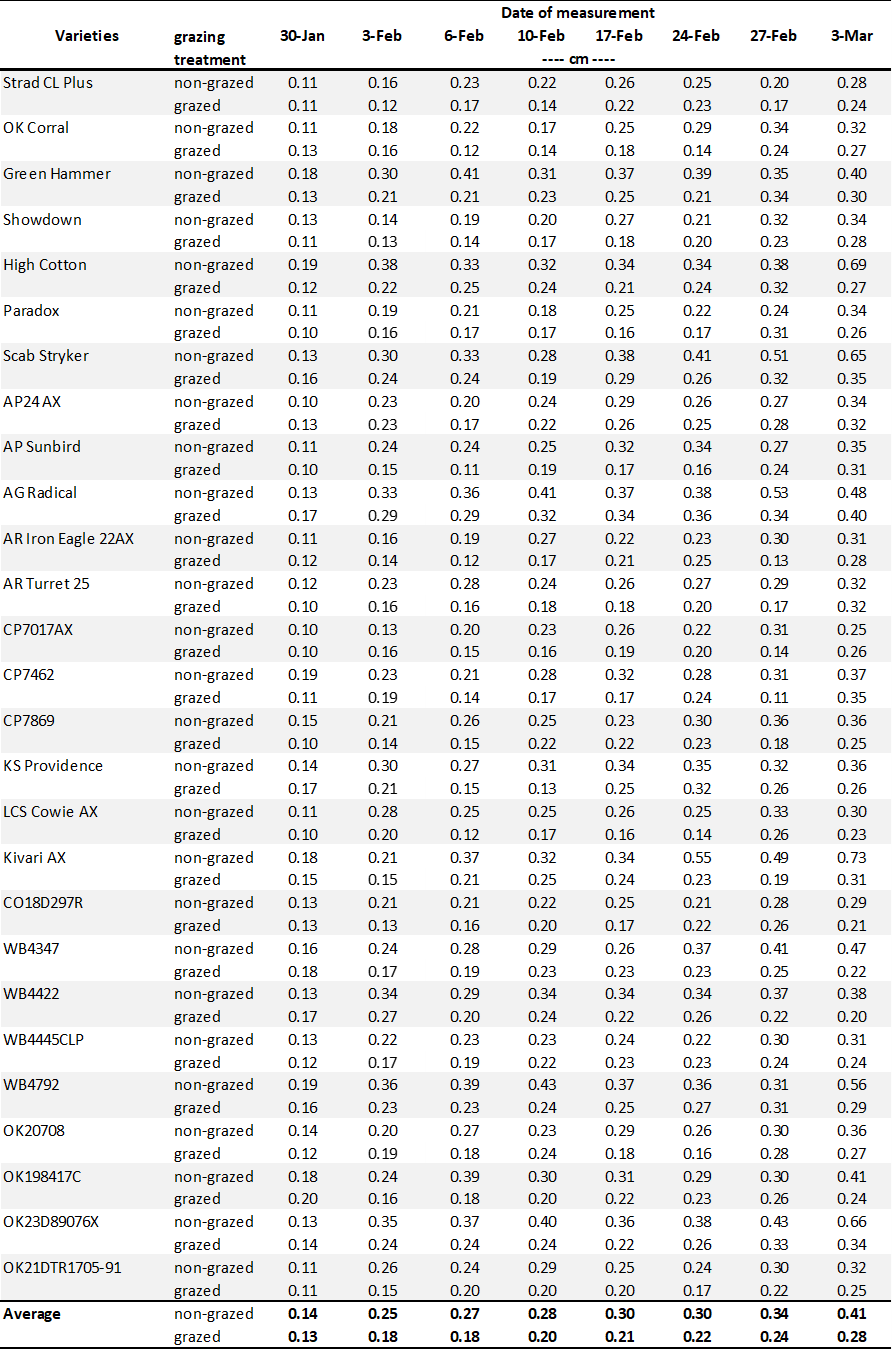
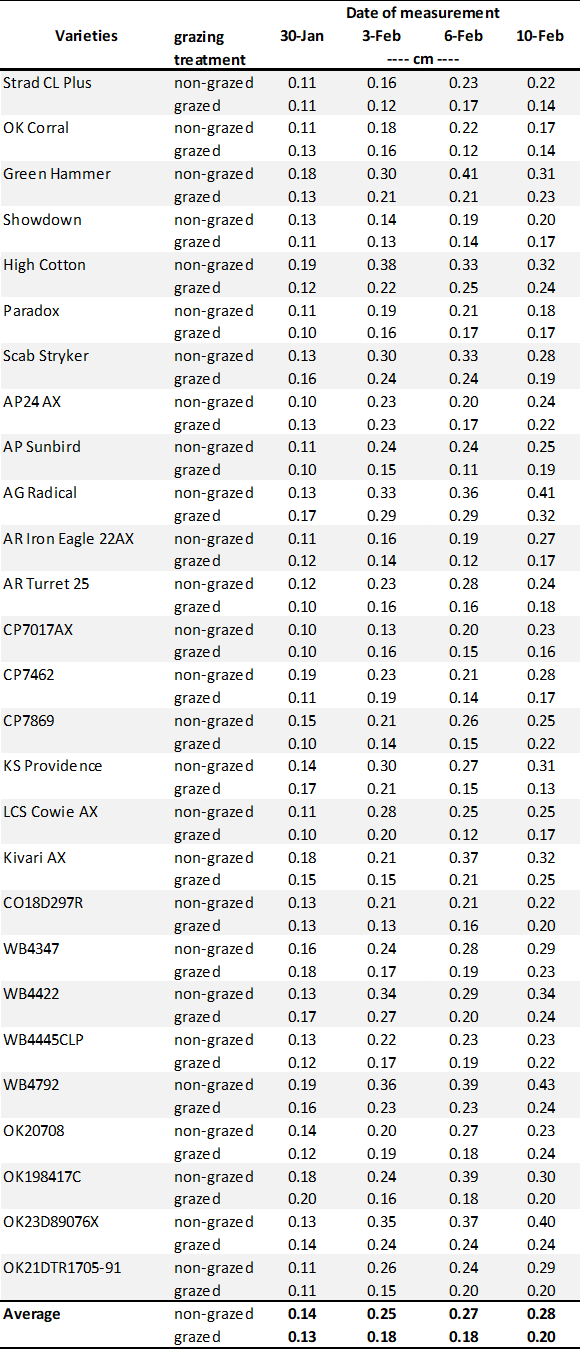
Table 1. First Hollow Stem (FHS) results for each wheat variety collected at Stillwater. Plots were planted on 10/11/24, with one section left unclipped and the other clipped to simulate grazing. The FHS threshold is 1.5 cm (5/8″ or approximately the diameter of a dime). Reported values represent the average of ten measurements per variety. Varieties that exceed the threshold are highlighted in red. For the simulated grazing, plots were mowed on January 3rd, 15th, 28th, February 10th, and March 6th at a 2.5-3” cutting height, with the frequency representing a light grazing treatment.

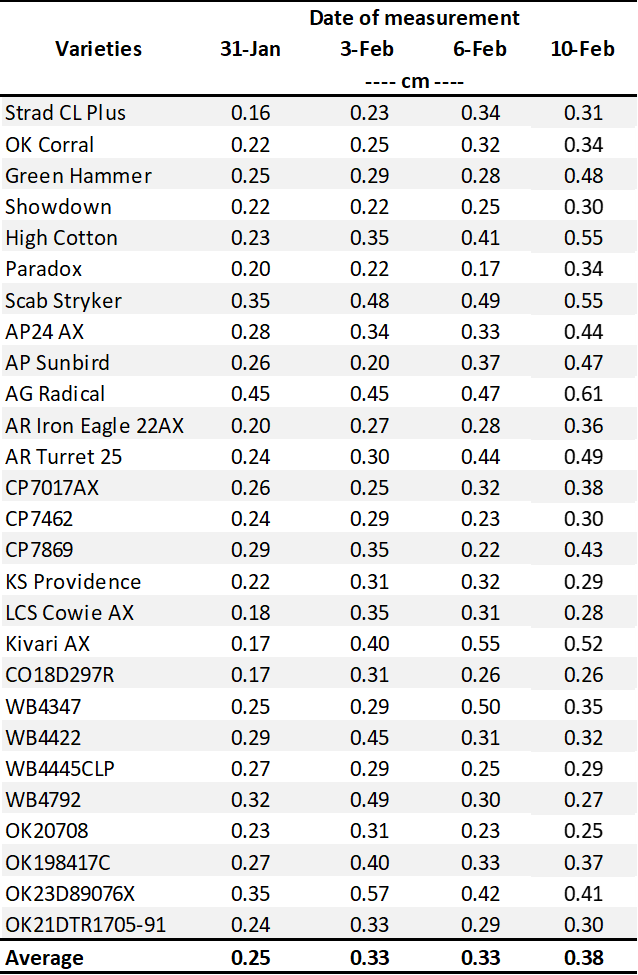
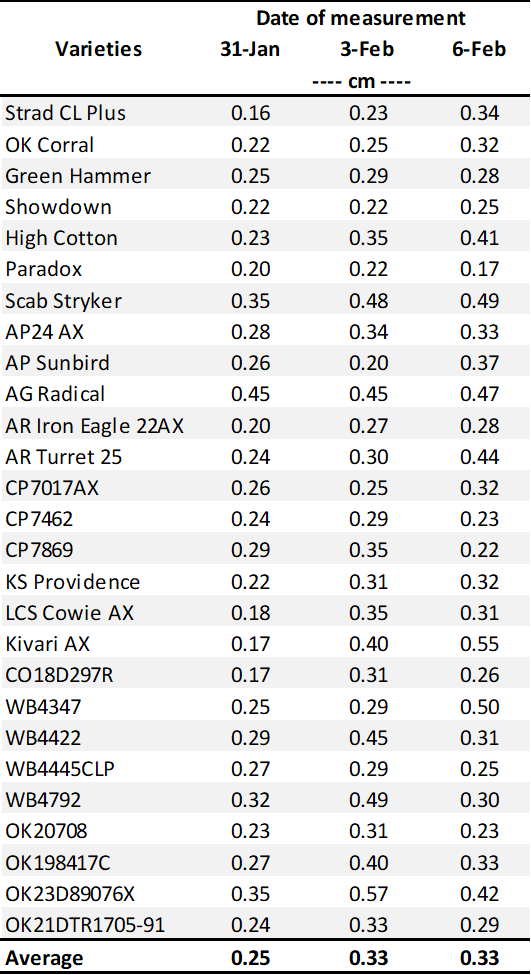
Table 2. First Hollow Stem (FHS) results for each wheat variety collected at Chickasha. Plots were planted on 10/02/24, with all sections left unclipped (i.e., not grazed). The FHS threshold is 1.5 cm (5/8″ or approximately the diameter of a dime). Reported values represent the average of ten measurements per variety. Varieties that exceed the threshold are highlighted in red.

Contact your local Extension office and us if you have questions.
Additional resources available:
- PSS-2147 First Hollow Stem: A Critical Wheat Growth Stage for Dual-Purpose Producers
- Fall Forage Production and First Hollow Stem Date for Wheat Varieties During the 2022-2023 Crop Year
- Mesonet First Hollow Stem Advisor
Acknowledgments:
Tyler Lynch, Senior Agriculturalist
Israel Molina Cyrineu, Graduate Research Assistant
Gilmar Machado, Visiting scholar
Rafael Moreira, Visiting scholar
Kenderson Reis, Visiting scholar
Francisco Arana, Visiting scholar