Home » Posts tagged 'variety testing'
Tag Archives: variety testing
Wheat protein report – 2014
This blog post contains information from OSU Current Report 2135 Protein Content of Winter Wheat Varieties in Oklahoma. A complete pdf version of the report with a brief explanation of sampling procedures can be found at www.wheat.okstate.edu.
The grass always seems to be greener on the other side when it comes to wheat protein. In a low protein year, everyone is scrambling to find higher protein wheat to blend. In a high protein year, such as this one, the same low protein wheat that was considered marginally acceptable the year before might command a slight premium. While wheat protein is important to end users, wheat protein is just one of many attributes which determine end-use quality and marketability of winter wheat. In fact, some millers and bakers would argue that functionality of wheat protein is more important than the quantity of protein. While varietal differences commonly exist, differences in wheat protein among environments are generally much larger than differences among varieties. Factors such as nitrogen fertility and drought stress, for example, can sharply impact final protein content of the grain, and most producers are better served focusing on good agronomic practices than slight genetic differences in wheat protein content.
To reflect environmental impacts on wheat grain protein content, 2014 wheat variety test data are reported by variety and location in Table 1. The 18.5% average wheat grain protein for the Thomas location is a good example of how fertility and environment can impact protein content. Soil tests at the time of sowing revealed 141 lb/acre of residual nitrogen available, which should be enough to produce a 70 bu/acre wheat crop. Due to extreme drought, however, average grain yield at Thomas was 13 bu/acre. Under these circumstances, wheat plants were able to pull large amounts of nitrogen from the soil and move this nitrogen to the developing grain. Grain size was reduced and grains were shriveled due to drought, thus resulting in abnormally high wheat protein. A similar situation was reported for Altus in 2013.
In Table 2 we reported the wheat grain protein content as a deviation from location mean for each variety, as this provides easier comparison of wheat grain protein among varieties across locations. Billings, for example, is a variety with solidly positive deviation from location means, indicating it has a tendency for above-average grain protein content. Iba, on the other hand, has negative deviations from location means, indicating a tendency for lower than average grain protein content. Adequate nitrogen fertility as recommended by a recent soil test or sensor-based nitrogen management program can help ensure that varieties such as Iba produce grain protein within the acceptable range for end-use customers. Iba is also a prime example of how protein data can sometimes be misused, as the functionality of the protein in Iba is above average, which can offset lower absolute grain protein content.
2014 Wheat Crop Overview
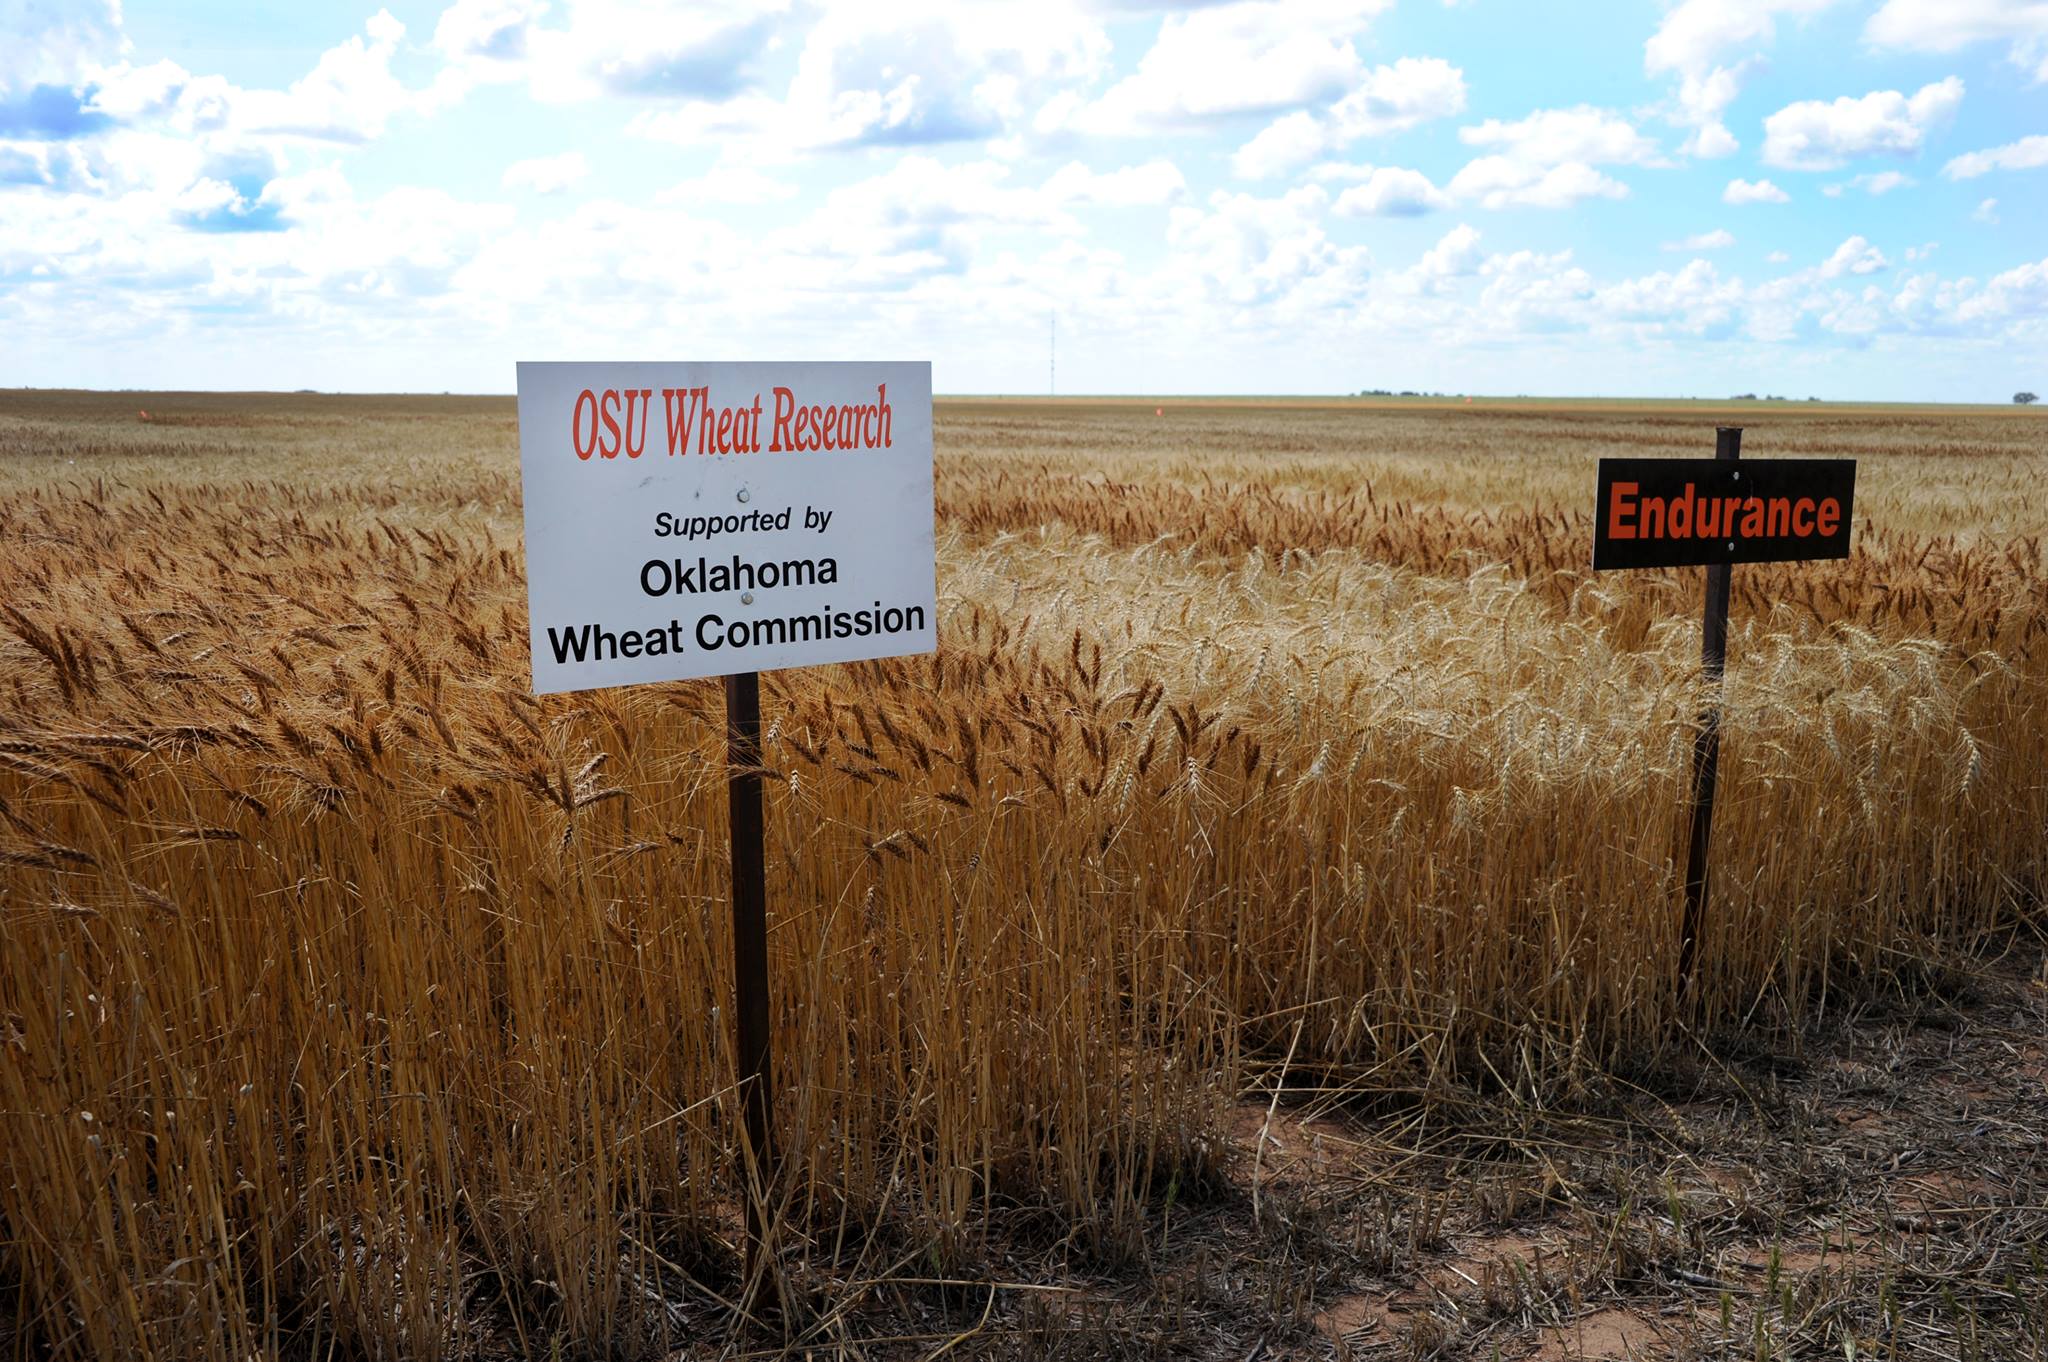
This blog post is an excerpt from the 2014 OSU Small Grains Variety Performance Tests report, which is available at http://www.wheat.okstate.edu or by clicking here.
At the time of writing this post, 2014 Oklahoma wheat production is estimated to be approximately 51 million bushels, which is roughly half of 2013 production (Table 1). Oklahoma has not seen wheat production this low since the 43 million bushel crop of 1957, and with any luck, production will not be this low again for at least another 60 years.
Table 1. Oklahoma wheat production for 2013 and 2014 as estimated by OK NASS, July 2014 | ||
2013 | 2014 | |
Harvested Acres | 3.4 million | 3.0 million |
Yield (bu/ac) | 31 | 17 |
Total bushels | 105 million | 51 million |
The 2013-2014 wheat production season had a good start in central Oklahoma. Topsoil moisture was short in September, but October rains resulted in favorable conditions for wheat emergence and establishment. In addition, many areas had a fair amount of stored soil moisture from the summer of 2013. This stored soil moisture allowed sites such as Chickasha and Lahoma to produce 43 and 47 bu/ac average wheat yield on less than eight inches of rainfall during the growing season. Stored soil moisture also contributed to adequate forage production at grazed sites such as Marshall Dual-Purpose, but production of a forage crop did not leave behind enough moisture to fuel much of a grain crop.
The multi-year drought never released its stranglehold on western Oklahoma during the 2013-2014 wheat production season. Small rains here or there allowed most producers to obtain an acceptable stand of wheat, but moisture was never sufficient to spur tillering or leaf area development. Early winter snowfall made for a few bright spots for forage production in southwestern Oklahoma, but this moisture was quickly utilized by growing wheat plants and dry conditions soon returned. As a result, many fields in southwestern and western Oklahoma were abandoned and not taken to harvest.

This photo of a wheat field near Altus, Oklahoma in April 2014 shows the level of devastation from the extreme, multi-year drought. Most wheat fields in this region were abandoned due to drought.
The winter of 2013-2014 wasn’t just dry; it was cold too. Young, drought-stressed wheat plants had difficulty dealing with the cold, windy conditions, and winterkill was common in late-sown wheat. Winterkill was also common in grazed wheat that was stressed by heavy grazing pressure and inadequate soil moisture. Considerable winterkill was also present in no-till wheat without adequate seed to soil contact in northwestern Oklahoma. The inadequate seed to soil contact was generally the result of heavy residue from the previous year’s wheat crop.

Winterkill was common in northwestern Oklahoma, with the greatest injury occurring in no-till and/or grazed wheat fields.

Closer inspection of some no-till fields with winterkill revealed shallow seed placement due to heavy and/or unevenly spread residue from the 2103 wheat crop.
While the wheat crop did not appear to be on its way to bumper production, most producers hoped for a turnaround similar to 2013 and topdressed in late winter. Unlike the spring of 2013, however, the rains never came and much of this topdress N applied did not make it into the soil until the crop was at boot stage or later.
The cold winter delayed the onset of first hollow stem by about five days as compared to 2013 and 25 days as compared to 2012. Despite a slow start to the spring, wheat in southern Oklahoma was near heading when a hard freeze occurred the morning of April 15, 2014. As expected, drought stressed wheat in advanced stages in southwestern Oklahoma suffered severe freeze damage; however, injury from the 2014 spring freeze did not always follow the “rule of thumb” guidelines used by agronomists. Many areas that received small amounts of rain just prior to the freeze seemed to escape widespread injury, regardless of growth stage. In southcentral Oklahoma, injury seemed to be most severe on later maturing varieties that were approximately Feekes GS 7 to booting, while earlier-maturing varieties that were just starting to head escaped freeze injury. Wheat that was barely past two nodes in northern Oklahoma suffered severe injury, while more advanced wheat in central Oklahoma endured similar temperatures with minimal injury.
There were relatively few insect or disease issues to deal with during the 2013-2014 wheat production season. Winter grain mite and/or brown wheat mite infestations proved to be too much for some drought stressed wheat fields in northcentral and northwestern Oklahoma. Some fields already devastated by the drought were left unsprayed, while others still showing some sign of yield potential were treated.

Injury, such as the bronzed areas in the picture above, was the result of brown wheat mite and/or winter grain mite infestations in late winter.
Other than a rare siting of a single leaf rust pustule, there was no foliar disease in Oklahoma in 2014. The lack of foliar disease is evidenced by the lack of response to foliar fungicides at either Chickasha or Lahoma. These two sites provided a rare opportunity in 2014 to observe yield impacts of foliar fungicides in the absence of disease, as most years we report at least light or negligible foliar disease at these sites. While foliar disease was not an issue in 2014, wheat streak mosaic virus was an issue for many producers. This disease has historically been most prevalent in northwestern Oklahoma and the Panhandle. Wheat streak mosaic virus was confirmed in several fields downstate this year, however, and it is likely that some fields affected by wheat streak mosaic virus were not identified as such because it is sometimes difficult to distinguish wheat streak mosaic virus symptoms from those of severe drought stress. The wheat variety testing program was not immune from this disease, and we lost our Kildare location to wheat streak mosaic virus.
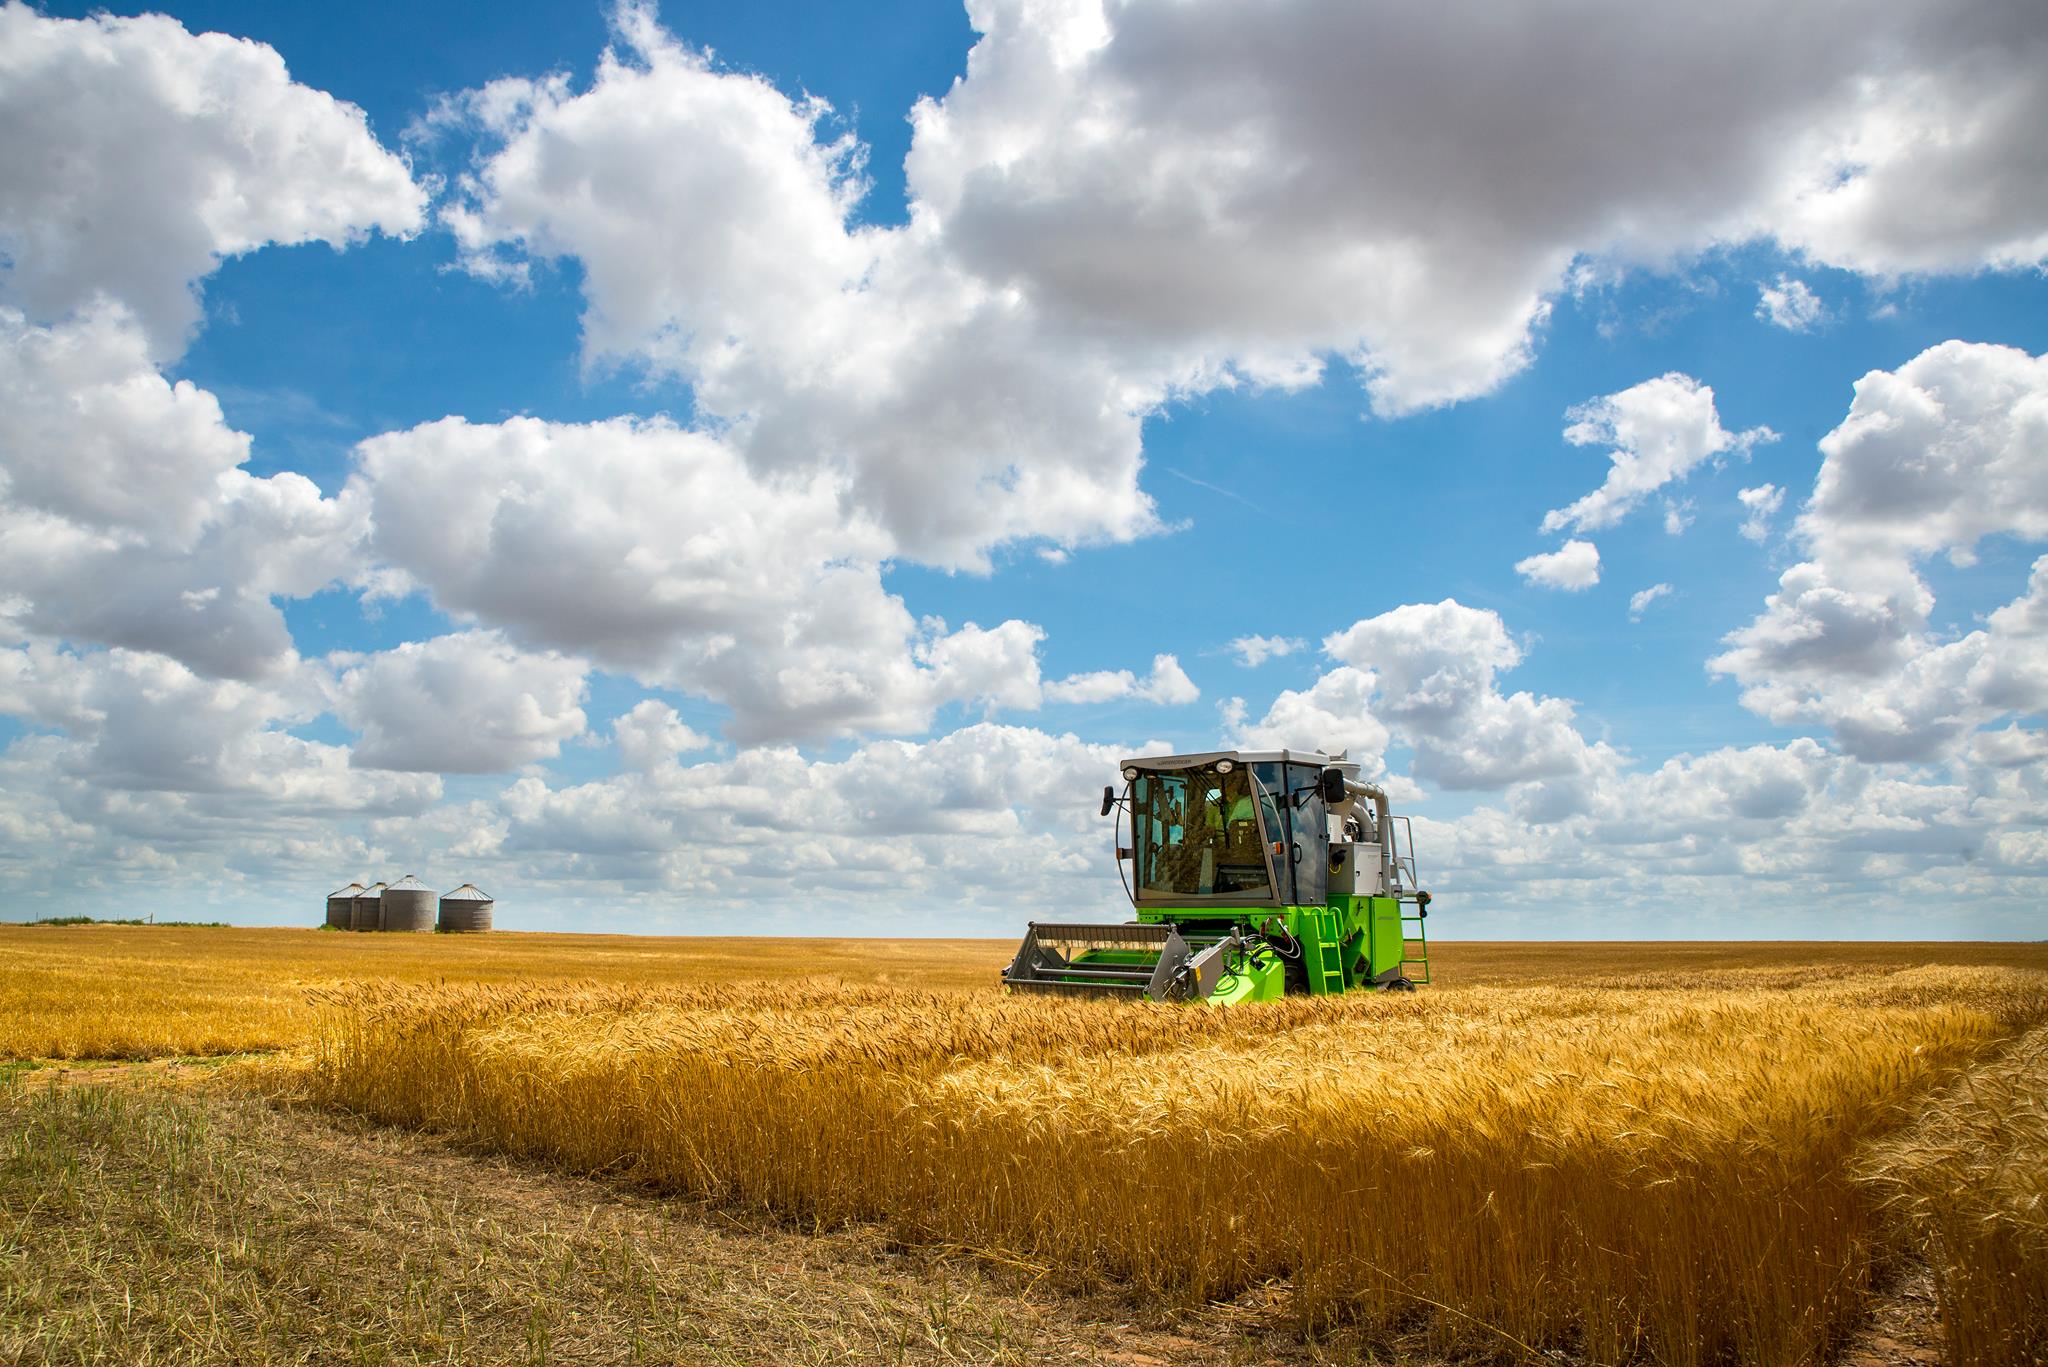
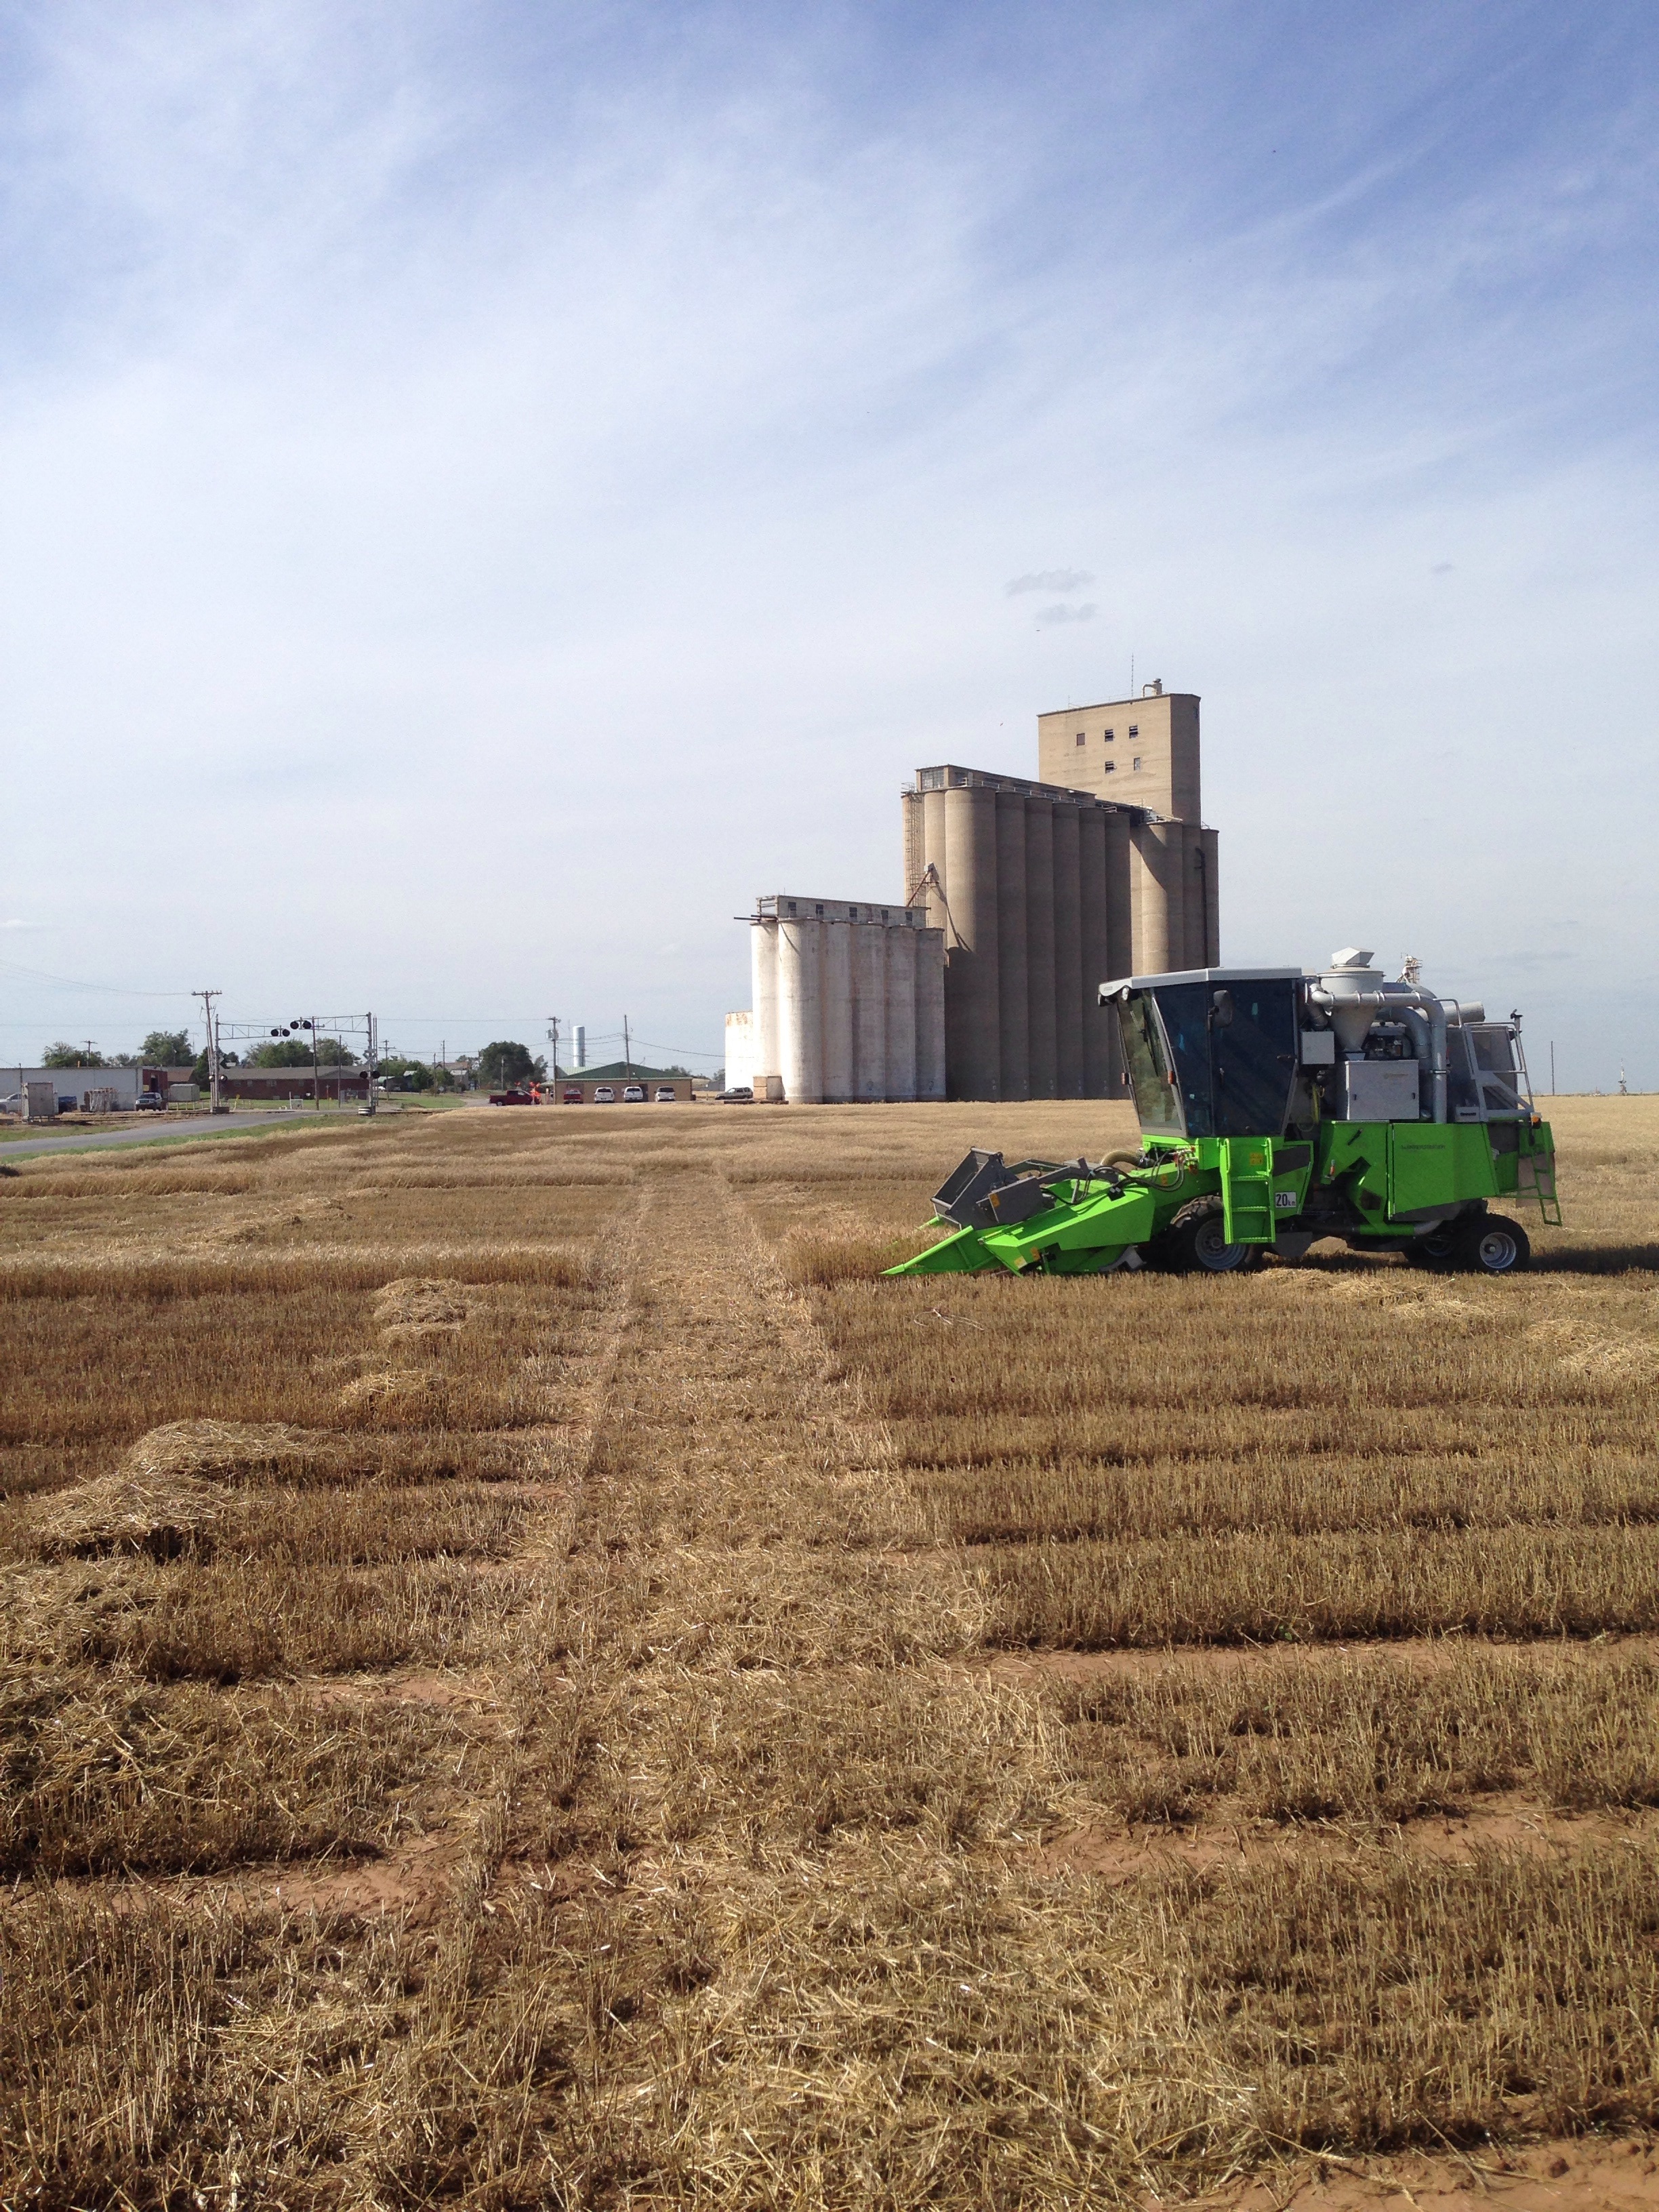
Warmer temperatures in May hastened crop maturity and the Oklahoma wheat harvest began near Frederick on May 22, 2014. By the first week of June, harvest was in full swing, only to be delayed by rain shortly thereafter. Harvest resumed across most of the state by June 13 and was mostly completed by June 30. The exceptions being some waterlogged areas in northern Oklahoma. The Cherokee Mesonet site, for example, reported 5.1 inches of rainfall from October 1, 2013 to May 31, 2014, but the same site received 10 inches of rain from June 1 to June 30, 2014.
Harvest underway
The 2014 Oklahoma wheat harvest is underway and results from the Walters and Thomas wheat variety trials are now posted at http://www.wheat.okstate.edu. Depending on field operations, I usually get variety trial results posted on the web within a day or two of harvest. The best way to learn when results are posted are to follow me on Twitter @OSU_smallgrains or subscribe to our Extension news list serve (send me an email at jeff.edwards@okstate.edu to be added to the listserv).
I have posted a few pics from our harvest operations below.

Wheat checkoff dollars make the Oklahoma Wheat Variety Testing program possible. We appreciate the support of our Oklahoma farmers!
2013-2014 Wheat fall forage variety trial results
This blog post is an abbreviated posting of our wheat forage results. For the complete report, consult OSU Current Report 2141 Fall forage production and date of first hollow stem in winter wheat varieties during the 2013-2014 crop year by clicking here.
As was the case across most of Oklahoma, our wheat plots were sown into dry topsoil in late September. Soils in southwest and northwest Oklahoma were extremely dry due to multiple years of drought, and wheat pasture was short in these areas of the state. Summer rainfall provided ample subsoil moisture in the central part of the state, but topsoil was largely dry through September. Rains fell across much of the state in October and provided the fuel needed to build wheat pasture. Unfortunately, these October rains would be the only significant rainfall events most of the Oklahoma wheat crop would receive .
Fall forage production by winter wheat at Stillwater and Chickasha averaged 3,240 and 2,580 pounds per acre, respectively (Tables below). There was a large group of varieties at Stillwater and Chickasha that produced statistically equivalent forage yield, and producers are encouraged to consider two and three year averages when available.
Table 2. Fall forage production by winter wheat varieties at Stillwater, OK during the 2013-2014 production year. | ||||
Source | Variety | 2013-2014 | 2-Year | 3-Year |
—————lbs dry forage/acre—————- | ||||
Syngenta | SY Llano | 4,100 | – | – |
AGSECO | TAM 113 | 4,090 | 3,160 | 3,220 |
OGI | Billings | 3,850 | 3,200 | 3,250 |
LCS | LCS Mint | 3,690 | – | – |
OGI | Duster | 3,670 | 3,180 | 3,300 |
OGI | Gallagher | 3,650 | 3,230 | 3,500 |
LCS | T154 | 3,640 | 3,040 | – |
Syngenta | Doans | 3,610 | – | – |
WestBred | WB4458 | 3,610 | 2,920 | – |
Syngenta | Jackpot | 3,600 | 3,060 | 3,150 |
WestBred | WB-Cedar | 3,560 | 3,240 | 3,250 |
OSU | Deliver | 3,470 | 2,770 | 3,010 |
WestBred | Winterhawk | 3,470 | 2,780 | 3,020 |
OGI | Garrison | 3,350 | 3,100 | 3,210 |
Watley | TAM 112 | 3,230 | – | – |
OGI | Doublestop CL Plus | 3,200 | 3,020 | – |
OGI | Pete | 3,160 | 2,810 | 3,020 |
Syngenta | CJ | 3,130 | 2,810 | 2,980 |
LCS | LCH08-80 | 3,120 | 2,950 | – |
WestBred | Armour | 3,110 | 3,000 | 3,100 |
LCS | LCH11-1117 | 3,110 | – | – |
OGI | Centerfield | 3,090 | 2,820 | 3,120 |
OGI | OK Bullet | 3,090 | 2,630 | 2,820 |
Syngenta | SY Southwind | 3,090 | – | – |
OSU | Endurance | 3,080 | 3,080 | 3,310 |
KWA | Everest | 3,050 | 2,810 | 3,010 |
Syngenta | Greer | 3,040 | 2,840 | 2,960 |
LCS | LCH11-1130 | 3,040 | – | – |
LCS | T158 | 3,020 | 2,760 | 3,000 |
CWRF | Brawl CL Plus | 2,980 | 2,860 | – |
OGI | Ruby Lee | 2,980 | 2,610 | 2,900 |
LCS | T153 | 2,960 | 2,840 | 3,090 |
OGI | Iba | 2,930 | 2,770 | 3,030 |
WestBred | WB-Grainfield | 2,910 | 2,920 | – |
WestBred | WB-Redhawk | 2,850 | 2,590 | – |
LCS | LCH11-109 | 2,750 | 2,990 | – |
OGI | OK Rising | 2,720 | 2,720 | – |
CWRF | Byrd | 2,670 | 2,590 | – |
OSU Experimentals | ||||
OK09125 | 2,800 | 2,540 | – | |
LSD (0.05) | 750 | 500 | 400 |
Table 3. Fall forage production by winter wheat varieties at Chickasha, OK during the 2013-2014 production year. | |||
Source | Variety | 2013-2014 | 2-Year |
–lbs dry forage/acre– | |||
OGI | Duster | 2,920 | 2,920 |
OGI | Gallagher | 2,920 | 3,010 |
LCS | T158 | 2,900 | 2,580 |
CWRF | Brawl CL Plus | 2,830 | – |
KWA | Everest | 2,750 | 2,750 |
OGI | Doublestop CL Plus | 2,700 | – |
WestBred | Winterhawk | 2,680 | – |
LCS | LCS Mint | 2,660 | – |
OSU | Endurance | 2,630 | 2,620 |
WestBred | WB-Cedar | 2,590 | 2,630 |
CWRF | Byrd | 2,540 | – |
Syngenta | Jackpot | 2,540 | 2,460 |
WB-Grainfield | WB-Grainfield | 2,530 | – |
WestBred | WB4458 | 2,520 | – |
OGI | Iba | 2,460 | 2,460 |
LCS | LCH08-80 | 2,440 | – |
OGI | Billings | 2,420 | – |
OGI | Ruby Lee | 2,420 | 2,430 |
OSU | Deliver | 2,410 | 2,200 |
Syngenta | Greer | 2,380 | 2,480 |
Syngenta | Doans | 2,210 | – |
OGI | Garrison | 2,160 | 2,220 |
OSU Experimentals | |||
OK09125 | 2,760 | – | |
Average | 2,580 | 2,560 | |
LSD | 430 | 290 | |
First hollow stem data are reported in ‘day of year’ (day) format (table below). To provide reference, keep in mind that March 1 is day 60. Average occurrence of first hollow stem at Stillwater in 2014 was day 77. This was approximately five days later than 2013 and 25 days later than in 2012 and was the result of much cooler than normal temperatures. Unlike previous years, there was only about ten days difference among varieties in occurrence of first hollow stem.
Table 4. Occurrence of first hollow stem (day of year) for winter wheat varieties sown in 2013 and measured in 2014 at Stillwater, OK | ||
Source | Variety | Stillwater |
–day of year– | ||
Syngenta | SY Llano | 72 |
WestBred | WB-Cedar | 72 |
OGI | Billings | 74 |
Syngenta | CJ | 74 |
KWA | Everest | 74 |
OGI | Gallagher | 74 |
Syngenta | Jackpot | 74 |
OGI | OK Bullet | 74 |
OGI | OK Rising | 74 |
Syngenta | SY Southwind | 74 |
LCS | T153 | 74 |
Watley | TAM 112 | 74 |
AGSECO | TAM 113 | 74 |
WestBred | Armour | 77 |
CWRF | Byrd | 77 |
OSU | Deliver | 77 |
Syngenta | Doans | 77 |
OGI | Duster | 77 |
OSU | Endurance | 77 |
OGI | Garrison | 77 |
Syngenta | Greer | 77 |
LCS | LCH11-109 | 77 |
LCS | LCH11-1117 | 77 |
LCS | LCH11-1130 | 77 |
LCS | LCS Wizard | 77 |
OGI | Pete | 77 |
LCS | T154 | 77 |
WestBred | WB-Redhawk | 77 |
WestBred | WB4458 | 77 |
WestBred | Winterhawk | 77 |
OGI | Doublestop CL Plus | 80 |
OGI | Iba | 80 |
LCS | LCS Mint | 80 |
OGI | Ruby Lee | 80 |
LCS | T158 | 80 |
WestBred | WB-Grainfield | 80 |
CWRF | Brawl CL Plus | 83 |
OGI | Centerfield | 83 |
OSU Experimentals | ||
OK11754WF | 69 | |
OK10728W | 74 | |
OK09520 | 77 | |
OK08707W-19C13 | 80 | |
OK09125 | 83 | |
OK10805W | 83 | |
OK10126 | 86 | |
Average | 77 |
Get to know the OSU Wheat Variety Testing Program
It occurred to me the other day that although I have publicized the forage, grain, and quality results from the OSU Wheat Variety Testing Program, I have never really given much effort to publicizing the day to day activities required to produce these results. So, over the next year I hope to write a few blogs to provide a little more insight into the workings of the system.
Location, location, location
Our program will have replicated trials at 23 sites in 2013/2014. These sites cover the state from Afton to Altus and McLoud to Keyes and some sites (e.g. Apache, Lahoma, Chickasha, Goodwell) have multiple trials. The location of trials are decided upon by throwing darts at a map (just kidding). We pick trial locations according to many factors including: visibility, uniformity, production history, local support, and cooperator involvement. Some locations (e.g. Lamont) have been in the system from the start, and others (e.g. McLoud) are fairly new additions. Given the miles between locations and a finite number of planting and harvest days, 23 locations is about the maximum we can handle and still complete operations in a timely fashion.
In addition to the small, replicated plots we organize and distribute ten-pound demonstration bags for County Educators. We typically have about 40 sets of 15 varieties for these ten pound “demo sets”.

OSU wheat variety testing locations cover Oklahoma from Afton to Altus and McLoud to Keyes. The Kingfisher location shown in this picture, also includes Dr. Carver’s elite nursery of advanced experimental lines
Who pays for all this?
The bulk of the expense of running the program comes in the form of salary, facilities, and miscellaneous overhead expenses and is largely covered by OSU through state appropriations (i.e. Oklahoma taxpayers). The bulk of the day to day operating expenses, such as seed, fuel, and mileage expenses, are covered through grants from the Oklahoma Wheat Commission and Oklahoma Wheat Research Foundation (i.e. Oklahoma wheat farmers). These two organizations also help with large equipment purchases such as tractors and combines. A relatively new area of support for the program is an entry fee system. The $500 per variety fee helps offset increasing expenses and is generally enough to assist with student labor for the project. We typically employ one or two graduate students and one or two undergraduate workers. Yes, we charge licensees for testing released OSU varieties but do not charge for OSU experimental lines.
Little packets of seed
Once we have determined which varieties will go at each location, we will send seed requests to participating companies. If everything goes well, we will receive seed in late August. We request one bag of most varieties and eight bags of varieties that will be included in the county demonstration packets.
Depending on the location, there are 25 to 45 varieties replicated four to eight times at each site. Each one of these plots starts with an envelope with either 60 (grain only) or 120 (dual purpose) grams of seed (120 grams is approximately 1/4 pound). This creates a total of about 4,000 envelopes that are weighed and packaged by hand each year. Envelopes are sorted according to a plot plan which randomly assigns varieties to locations within the field at each site. The plots plans are all created one at a time in Excel.
Planting five feet at a time
We have two planters. Our conventional planter sows eight six-inch rows and our no-till planter sows seven 7.5-inch rows. Seed is dropped into the distribution cone and released in the five foot alley between replications/blocks. A gear box is used to adjust the length of row over which the seed will be distributed. We work the ground with a small field cultivator at some locations and the producer or station manager works the ground for us at others.

Robert Calhoun and Matt Knori sow the 2013/2014 wheat variety test plots at Alva, OK. Robert is dropping a 60 gram envelope of seed into the cone that will evenly distribute the seed across eight six-inch rows over a distance of 25 ft.
The red boxes on the back are for 18-46-0 (DAP). We apply 50 lbs of DAP in furrow at all locations.
Photo courtesy Woods County Educator Greg Highfill
2013 Wheat variety performance test results posted
All Oklahoma wheat variety test sites are now harvested and the results are posted at www.wheat.okstate.edu. I have posted a brief summary of the 2013 crop below. Over the next several weeks, I will be posting additional trial results on this blog along with opinion and analysis of results.
2013 WHEAT CROP OVERVIEW
At the time of writing this report, 2013 Oklahoma wheat production is estimated to be approximately 114 million bushels, which is roughly 26% less than 2012 production (Table 1). The production decrease was due to the combination of lower yields and fewer harvested acres. Given the challenges faced in the 2012-2013 wheat production year, however, most would consider the average yield and total production to be much better than expected.
Table 1. Oklahoma wheat production for 2012 and 2013 as estimated by OK NASS, June 2013 | ||
2012 |
2013 |
|
Harvested Acres |
4.3 million |
3.8 million |
Yield (bu/ac) |
36 |
30 |
Total bushels |
154.8 million |
114 million |
We have had several dry starts for wheat planting in Oklahoma, but the fall of 2012 might go down as the driest of the dry. A few timely rains in late August and early September allowed early and mid-September sown wheat to emerge and get a rapid start on forage production. This was the last substantial rain that most of western Oklahoma received until early 2013. As a result, much of our October-sown crop remained partially emerged in dry soil until after the first of the year.
Wheat that had emerged in September had consumed available water by early November and turned brown by December. Many fields were assumed dead, as there was no green tissue remaining above the soil surface (e.g. Marshall Dual-Purpose trial). This left little to no grazing potential for many dual-purpose wheat producers. Our Stillwater forage trial, for example, had less than 500 lb/ac (estimated) of available forage in early December, which is our normal forage measurement timing.
Rain was not plentiful in early 2013, but there was enough to allow the wheat crop to rebound. Wheat seed that had been lying in the soil germinated and early-emerging fields that had turned brown from drought were resuscitated and brought back to life. Wheat in southwestern OK and the Panhandle remained on life support throughout the season, surviving but never really thriving. Given these extreme circumstances, the grain yield at our Chattanooga, Altus, and Hooker sites are nothing short of amazing. Although wheat finally emerged at our Alva, Balko, Buffalo, Cherokee, Gage, Keyes, and Lamont sites, the stands were far too variable for use in comparing the yield potential of wheat varieties.
Drought was not the only weather-related issue Oklahoma wheat producers dealt with in 2013. There were multiple rounds of freeze events in late March and early April. Wheat in southwest Oklahoma and the Panhandle was affected by different freeze events but both sustained 30 to 80% tiller loss and were largely written off in the weeks following the freezes. Outside of far southwestern OK, cooler than normal conditions and some replenishment of soil moisture allowed regeneration of tillers. This, along with extended grainfill duration, allowed many wheat fields to recover and produce greater than expected grain yields (e.g. Apache variety trial). The cooler than normal spring temperatures were beneficial for wheat grainfill, but also delayed harvest by about one month as compared to 2012 and about two weeks as compared to the long term average.
It was a fairly quiet year regarding foliar disease. Pockets of the state suffered from heavy powdery mildew infestation in March and April, and some wheat producers chose to split-apply fungicides to combat this disease. There were also areas affected by glume blotch, tan spot, and septoria, but there was not much leaf or stripe rust present.
Yellow and purple leaves were tell tale signs that a late spring flush of aphids had transmitted barley yellow dwarf virus to several Oklahoma wheat fields. Armyworms were present late in the season, but generally did not reach threshold levels prior to maturity and few fields were sprayed. Winter grain mites took advantage of slow-growing, drought-stressed wheat and were a frequently reported problem in southwest OK, but the wheat curl mite takes top billing among mite pests in 2013. The wheat curl mite transmits wheat streak mosaic and high plains viruses. These two diseases are fairly common in the Panhandle but do not typically affect wheat in central OK. In 2013 fields as far east as Kingfisher tested positive for wheat streak mosaic and several central OK fields were affected. Growers affected by wheat streak mosaic should take care to ensure that any volunteer wheat or corn is dead at least two weeks prior to planting to reduce the risk of this disease in 2013-2014.
Wheat better than expected at Chattanooga, Kingfisher, and Chickasha
Chattanooga, Kingfisher, and Chickasha wheat variety trial results are posted at www.wheat.okstate.edu. Grain yields at Chattanooga ranged from 12 to 36 bushels per acre. It is truly amazing that wheat somehow managed to produce these yields this in the presence of severe drought and three major freezes. Kingfisher wheat grain yields ranged from 32 to 47 bushels per acre and were more or less on par with expectations. This site had less than ideal moisture conditions, but adequate moisture to keep the wheat from turning brown as it did in many locations.
The Chickasha wheat variety trial had some problems. A late March freeze killed up to 58% of viable tillers in some varieties and lodging at harvest was moderate to severe. While leaf rust and stripe rust were not major factors, we did have a variety of leaf spotting diseases (e.g. tan spot, septoria, glum blotch) and severe, widespread bacterial blight/black chaff throughout the plot. In spite of these challenges, average yield at this site was 69 bushels per acre with yields ranging from 50 to 83 bushels per acre. While these yields are outstanding given the challenges of the year, they are not the best at the Chickasha research station. Approximately 200 feet from the variety trial was a growth regulator study planted to Iba that produced 98 to 102 bushels per acre. I have this same trial at two additional locations and will summarize results later in the year.
Altus wheat variety trial results
It was a rough year to farm wheat in Altus, OK. Our plots were sown into extremely dry soil on October 8, 2012 and received a total of 1.08 inches of rain by December 31. Total rainfall for the entire season was only 7.9 inches. Under these conditions it is amazing that wheat survived, but we somehow entered March with approximately 30 bu/ac yield potential. Some production fields in the area had 50 bu/ac potential and needed nothing more than a few rains to maintain this yield potential. The rains never came and Mother Nature dealt an additional card from the bottom of the deck with major freeze events in late March, late April, and early May.
Altus wheat variety trial results are posted at www.wheat.okstate.edu. Top varieties this year were Doublestop CL Plus (25 bu/ac), WB-Grainfield (22bu/ac), and the OSU experimental lines OK08328 (23 bu/ac) and OK09125 (22 bu/ac). Eleven out of 39 varieties made less than 10 bu/ac, and it is hard to say if drought or freeze had the larger effect on wheat yield. Based on the maturity rating of the top yielding varieties (ie late maturing) one could make the argument that freeze had the larger effect, but some relatively early and medium maturing varieties performed relatively well in the presence of the freeze (e.g. Duster and OK Bullet). The interactions are complicated and not easily explained.
Additional variety trial results will be posted as locations are harvested. To keep up with the latest results, follow me on Twitter @OSU_smallgrains